BinPan Module
import binpan
Symbol Class
The main entry point in BinPan. Fetches candlestick (kline) data from the Binance API and provides methods for technical indicators, plotting, trade analysis, and strategy backtesting.
The Symbol class uses a mixin architecture:
SymbolIndicators: technical indicators (EMA, RSI, MACD, Bollinger Bands, etc.)
SymbolPlotting: candlestick charts, trade visualizations, order book plots
SymbolStrategy: tagging, cross detection, backtesting engine
Example notebooks are in the notebooks/ folder of the repository.
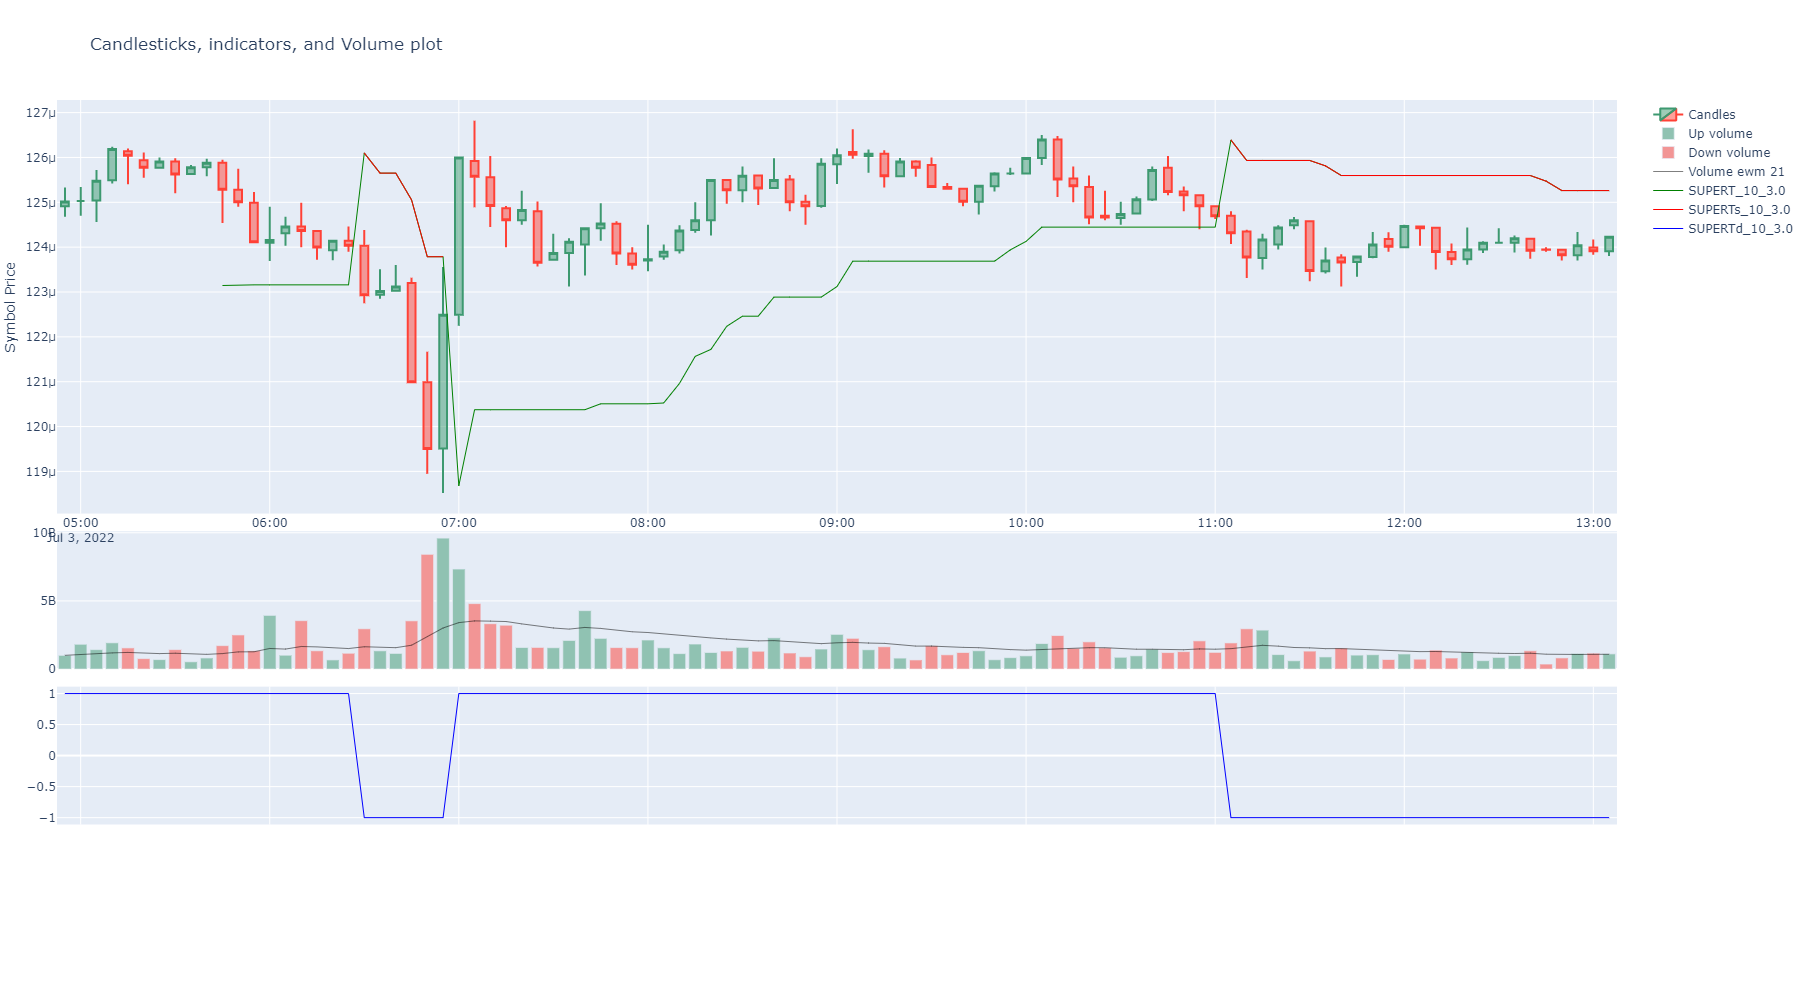
- class Symbol(symbol: str = None, tick_interval: str = None, start_time: int | str = None, end_time: int | str = None, limit: int = 1000, time_zone: str = 'Europe/Madrid', closed: bool = True, hours: float = None, postgres_klines: bool | str = False, postgres_agg_trades: bool | str = False, postgres_atomic_trades: bool | str = False, binbase: bool | str = False, display_columns: int = 25, display_max_rows: int = 10, display_min_rows: int = 25, display_width: int = 320, from_csv: bool | str = False, info_dic: dict = None)[source]
Creates an object from binance klines and/or trade data. It contains the raw api response, a dataframe that can be modified and many more.
Symbols can be any trading pair on Binance, such as BTCUSDT or ETHBUSD, and time intervals can be specified using the following strings:
`
'1m', '3m', '5m', '15m', '30m', '1h', '2h', '4h', '6h', '8h', '12h', '1d', '3d', '1w', or '1M'
`
The class provides several plotting methods for quick data visualization.
- Parameters:
symbol (str) – It can be any symbol in the binance exchange, like BTCUSDT, ethbusd or any other. Capital letters don’t matter.
tick_interval (str) – Any candle’s interval available in binance. Capital letters don’t matter.
It can be an integer in milliseconds from epoch (1970-01-01 00:00:00 UTC) or any string in the formats:
- %Y-%m-%d %H:%M:%S.%f:       **2022-05-11 06:45:42.124567**
- %Y-%m-%d %H:%M:%S:          **2022-05-11 06:45:42**
If start time is passed, it gets the next open according to the tick interval selected except an exact open time passed.
It can be an integer in milliseconds from epoch (1970-01-01 00:00:00 UTC) or any string in the formats:
- %Y-%m-%d %H:%M:%S.%f:       **2022-05-11 06:45:42.124**
- %Y-%m-%d %H:%M:%S:          **2022-05-11 06:45:42**
If end time is passed, it gets candles till the previous close according to the selected tick interval.
Example with daily time saving inside the interval:
import binpan

btcusdt = binpan.Symbol(symbol='btcusdt',
                        tick_interval='15m',
                        time_zone='Europe/Madrid',
                        start_time='2021-10-31 01:00:00',
                        end_time='2021-10-31 03:00:00')

btcusdt.df

                                Open                High            Low             Close           Volume
BTCUSDT 15m Europe/Madrid

2021-10-31 01:00:00+02:00   61540.32        61780.44        61488.35        61737.39        316.93504
2021-10-31 01:15:00+02:00   61737.39        61748.13        61486.86        61637.99        485.50681
2021-10-31 01:30:00+02:00   61637.99        61777.71        61479.76        61743.32        441.29718
2021-10-31 01:45:00+02:00   61743.31        61900.00        61640.55        61859.19        505.87893
2021-10-31 02:00:00+02:00   61859.19        62328.38        61859.18        62328.13        1046.30598
2021-10-31 02:15:00+02:00   62328.13        62399.00        62142.74        62246.30        679.96187
2021-10-31 02:30:00+02:00   62246.30        62371.72        62171.01        62301.39        355.25273
2021-10-31 02:45:00+02:00   62301.39        62400.15        62220.27        62375.29        568.02797
2021-10-31 02:00:00+01:00   62375.28        62405.30        62260.01        62367.79        421.52566
2021-10-31 02:15:00+01:00   62367.79        62394.06        62219.50        62270.00        537.53843
2021-10-31 02:30:00+01:00   62270.00        62371.49        62156.83        62169.01        452.62728
2021-10-31 02:45:00+01:00   62169.01        62227.00        62114.18        62169.00        283.45948
limit (int) –
The limit is the quantity of candles requested. Can combine with start_time or end_time:
If no start or end timestamp passed, gets current timestamp and limit of candles backwards.
If just start time or endtime passed, then applies the limit to find the endtime or start time respectively.
if endtime and start time passed, it gets all the ticks between, even if more than 1000 by calling several times to API until completed. Limit ignored.
time_zone (str) –
The index of the pandas dataframe in the object can be converted to any timezone, i.e. “Europe/Madrid”
The binance API use milliseconds from epoch (1970-01-01 00:00:00 UTC), that means that converting to a timezoned date with daily time saving changes, the result would show the change in the timestamp.
Candles are ordered with the timestamp regardless of the index name, even if the index shows the hourly change because daily time saving changes.
closed (bool) – The last candle is a closed one in the moment of the creation, discarding the current running one not closed yet. Default True.
display_columns (int) – Number of columns in the dataframe display. Convenient to adjust in jupyter notebooks.
display_max_rows (int) – Number of rows in the dataframe display. Convenient to adjust in jupyter notebooks.
display_width (int) – Display width in the dataframe display. Convenient to adjust in jupyter notebooks.
display_min_rows (int) – Number of rows in the dataframe display. Convenient to adjust in jupyter notebooks.
postgres_klines (bool or str) – If True, gets data from a postgres database by selecting interactively from tables found. Also a string with table name can be used. If str passed, it will be used as host.
postgres_agg_trades (bool) – If True, gets data from a postgres database by selecting interactively from tables found. Also a string with table name can be used. If str passed, it will be used as host.
postgres_atomic_trades (bool) – If True, gets data from a postgres database by selecting interactively from tables found. Also a string with table name can be used. If str passed, it will be used as host.
binbase (bool or str) – If True, gets data from binbase TimescaleDB (shared schema with symbol column). If str passed, it will be used as host. Password from
BINBASE_PASSWORDenv var or panzer’sbinbase_password(~/.panzer_creds).hours (float) – If hours is passed, it gets the candles from the last hours.
from_csv (bool or str) – If True, gets data from a csv file by selecting interactively from csv files found. Also a string with filename can be used.
info_dic (dict) – Sometimes, for iterative processes, info_dic can be passed to avoid calling API for it. Its weight is heavy.
from_csv – If True, gets data from a csv file by selecting interactively from csv files found. Also a string with filename can be used.
info_dic – Sometimes, for iterative processes, info_dic can be passed to avoid calling API for it. Its weight is heavy.
Examples:
binpan_object = binpan.Symbol(symbol='ethbusd',
                              tick_interval='5m',
                              limit=100,
                              display_rows=10)
binpan_object.df

              Open    High    Low     Close   Volume          Quote volume    Trades  Taker buy base volume   Taker buy quote volume

ETHBUSD 5m UTC

2022-06-22 08:55:00+00:00       1077.29 1081.11 1076.34 1080.18 810.1562        8.737861e+05    1401.0  410.0252        4.422960e+05
2022-06-22 09:00:00+00:00       1080.28 1087.31 1079.90 1085.03 2446.4199       2.653134e+06    3391.0  1253.6380       1.359514e+06
2022-06-22 09:05:00+00:00       1085.14 1085.98 1080.70 1080.99 1502.4415       1.628110e+06    1664.0  509.9937        5.525626e+05
2022-06-22 09:10:00+00:00       1080.79 1084.53 1080.26 1083.30 906.5092        9.814984e+05    1438.0  514.6718        5.573028e+05
2022-06-22 09:15:00+00:00       1083.42 1085.35 1081.41 1081.53 1191.9566       1.291633e+06    1549.0  736.5743        7.983178e+05
...     ...     ...     ...     ...     ...     ...     ...     ...     ...
2022-06-22 16:50:00+00:00       1067.61 1070.00 1066.21 1069.32 1951.1378       2.084288e+06    1535.0  1396.4956       1.491744e+06
2022-06-22 16:55:00+00:00       1069.47 1078.61 1069.47 1077.78 2363.1639       2.539150e+06    3578.0  1239.7735       1.332085e+06
2022-06-22 17:00:00+00:00       1077.96 1079.32 1071.25 1073.00 1452.3712       1.560748e+06    2534.0  651.9175        7.006751e+05
2022-06-22 17:05:00+00:00       1072.76 1075.04 1071.00 1073.47 728.9761        7.820787e+05    1383.0  303.3896        3.254396e+05
2022-06-22 17:10:00+00:00       1073.42 1076.30 1073.24 1075.77 228.4269        2.456515e+05    426.0   127.7424        1.373634e+05
100 rows × 9 columns
Methods:
save_csv([timestamped_filename])Saves current klines DataFrame to a csv file.
save_atomic_trades_csv([timestamped_filename])Saves current atomic trades to a csv file.
save_agg_trades_csv([timestamped_filename])Saves current aggregated trades to a csv file.
set_display_max_columns([display_columns])Method to change the maximum number of columns shown in the display of the dataframe.
set_display_min_rows([display_min_rows])Method to change the number of minimum rows shown in the display of the dataframe.
set_display_max_rows([display_max_rows])Method to change the number of maximum rows shown in the display of the dataframe.
set_display_width([display_width])Method to change the width shown in the display of the dataframe.
set_display_decimals(display_decimals)Method to change the number of decimals shown in the display of the dataframe.
basic([exceptions, actions_col])Shows just a basic selection of columns data in the dataframe.
drop([columns_to_drop, inplace])It drops some columns from the dataframe.
delete_indicator_family(indicator_name_root)Deletes indicator from dataframe.
insert_indicator(source_data[, ...])Adds one or more indicators to the DataFrame in place.
hk([inplace])It computes Heikin Ashi candles.
Get the first Open timestamp and the last Open timestamp.
Get the first Open timestamp and the last Open timestamp, and converts to timezoned dates.
get_agg_trades([hours, minutes, startTime, ...])Calls the API and creates another dataframe included in the object with the aggregated trades from API for the period of the created object.
get_atomic_trades([hours, minutes, ...])Calls the API and creates another dataframe included in the object with the atomic trades from API for the period of the created object.
is_new(source_data[, suffix])Verify if indicator columns are previously created to avoid allocating new rows and colors etc.
get_reversal_agg_candles([min_height, ...])Resamples aggregated API trades to reversal klines:
get_reversal_atomic_candles([min_height, ...])Resamples API atomic trades to reversal klines:
resample(tick_interval[, inplace])Resample trades to a different tick interval.
Repair kline discontinuities by filling missing candles.
accumulation_distribution([inplace, suffix, ...])Accumulation/Distribution indicator.
alternating_fractal([max_period, inplace, ...])Obtains the minim value for fractal_w periods as fractal is pure alternating from max to min to max etc.
atr([length, inplace, suffix, color])Average True Range.
backtesting(actions_col[, target_column, ...])Simulates buys and sells using labels in a tagged column with actions.
bbands([length, std, ddof, inplace, suffix, ...])These bands consist of an upper Bollinger band and a lower Bollinger band and are placed two standard deviations above and below a moving average.
cci([length, scaling, inplace, suffix, color])Compute the Commodity Channel Index (CCI) for NIFTY based on the 14-day moving average.
clean_in_out(column[, in_tag, out_tag, ...])It cleans a serie with in and out tags by eliminating in streaks and out streaks.
cross(slow[, fast, cross_over_tag, ...])It tags crossing values from a column/serie (fast) over a serie or value (slow).
ema([window, column, inplace, suffix, color])Generate technical indicator Exponential Moving Average.
eom([length, divisor, drift, inplace, ...])Ease of Movement (EMV) can be used to confirm a bullish or a bearish trend.
ffill_window(column[, window, inplace, ...])It forward fills a value through nans a window ahead.
fractal([period, inplace, overlap_plot, ...])The fractal indicator is based on a simple price pattern that is frequently seen in financial markets.
get_maker_taker_buy_ratios([window, ...])Generates the makers versus makers+takers volume ratio by each_kline.
get_market_profile([bins, hours, minutes, ...])Generates a market profile dataframe from trade or kline data.
Returns column names starting with "Strategy".
get_taker_maker_ratio_profile([bins, hours, ...])Generates a market profile of the makers versus makers+takers volume ratio by each_kline.
ichimoku([tenkan, kijun, chikou_span, ...])The Ichimoku Cloud is a collection of technical indicators that show support and resistance levels, as well as momentum and trend direction.
ma([ma_name, column_source, inplace, ...])Generic moving average method.
macd([fast, slow, smooth, inplace, suffix, ...])Generate technical indicator Moving Average, Convergence/Divergence (MACD).
merge_columns(main_column, other_column[, ...])Predominant serie will be filled nans with values, if existing, from the other serie.
on_balance_volume([inplace, suffix, color])On balance indicator.
pandas_ta_indicator(name, **kwargs)Calls any indicator in pandas_ta library with function name as first argument and any kwargs the function will use.
plot([width, height, ...])Plots a candles figure for the object.
plot_agg_trades_size([max_size, height, ...])It plots a time series graph plotting aggregated trades sized by quantity and color if taker or maker buyer.
plot_aggression_sizes([bins, hist_funct, ...])Binance fees can be cheaper for maker orders, many times when big traders, like whales, are operating .
plot_atomic_trades_size([max_size, height, ...])It plots a time series graph plotting atomic trades sized by quantity and color if taker or maker buyer.
plot_market_profile([bins, hours, minutes, ...])Plots volume histogram by prices segregated aggressive buyers from sellers.
plot_orderbook([accumulated, title, height, ...])Plots orderbook depth.
plot_orderbook_density([x_col, color, bins, ...])Plot a distribution plot for a dataframe column.
plot_reversal([min_height, min_reversal, ...])Plots reversal candles.
plot_taker_maker_ratio_profile([bins, ...])Plots taker vs maker ratio profile.
plot_trades_pie([categories, logarithmic, title])Plots a pie chart.
plot_trades_scatter([x, y, dot_symbol, ...])A scatter plot showing each price level volume or trades.
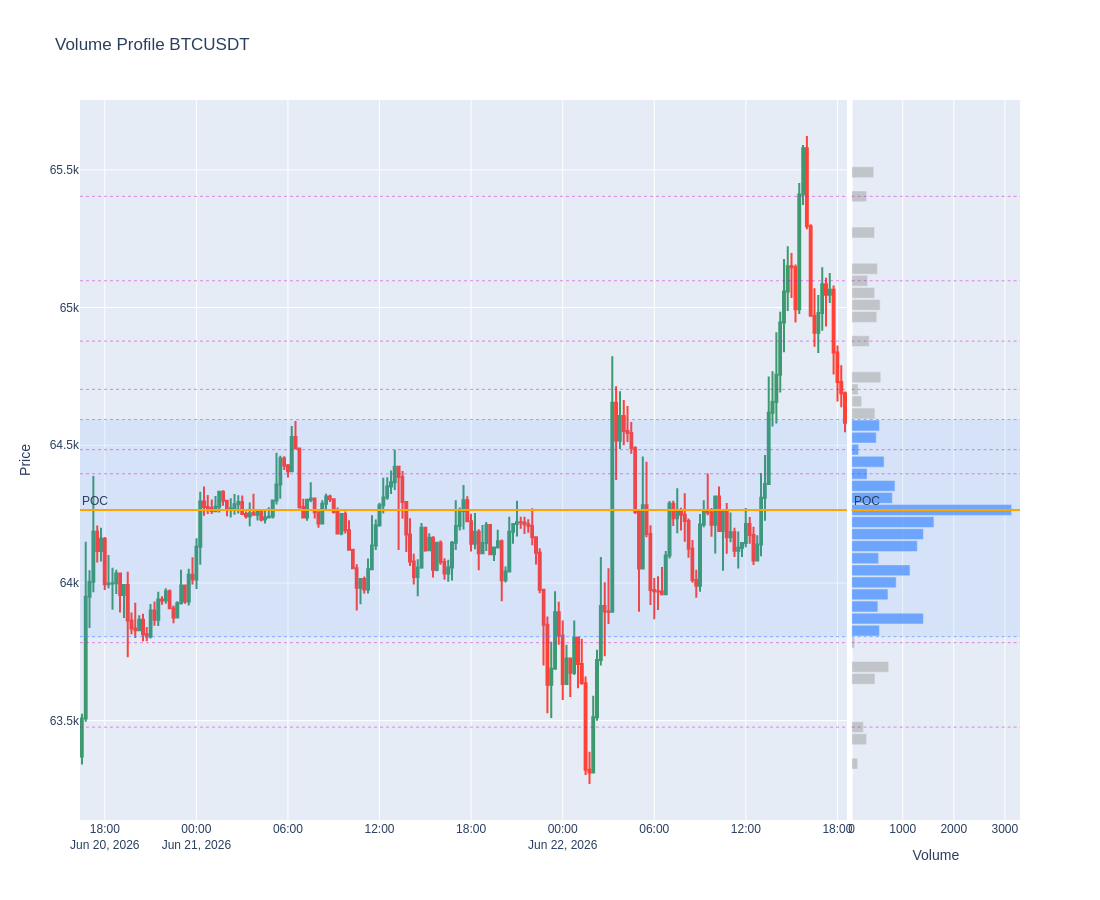
plot_volume_profile([bins, value_area_pct, ...])Volume Profile (VPVR): velas + histograma horizontal de volumen, con POC y Value Area.
profit_hour([column])It returns win or loos quantity per hour.
remove_plot_info_associated_columns(columns, ...)Completely remove plot info for a column in main dataframe of klines.
remove_plot_info_for_column(column)Remove plot info for a column in main dataframe of klines.
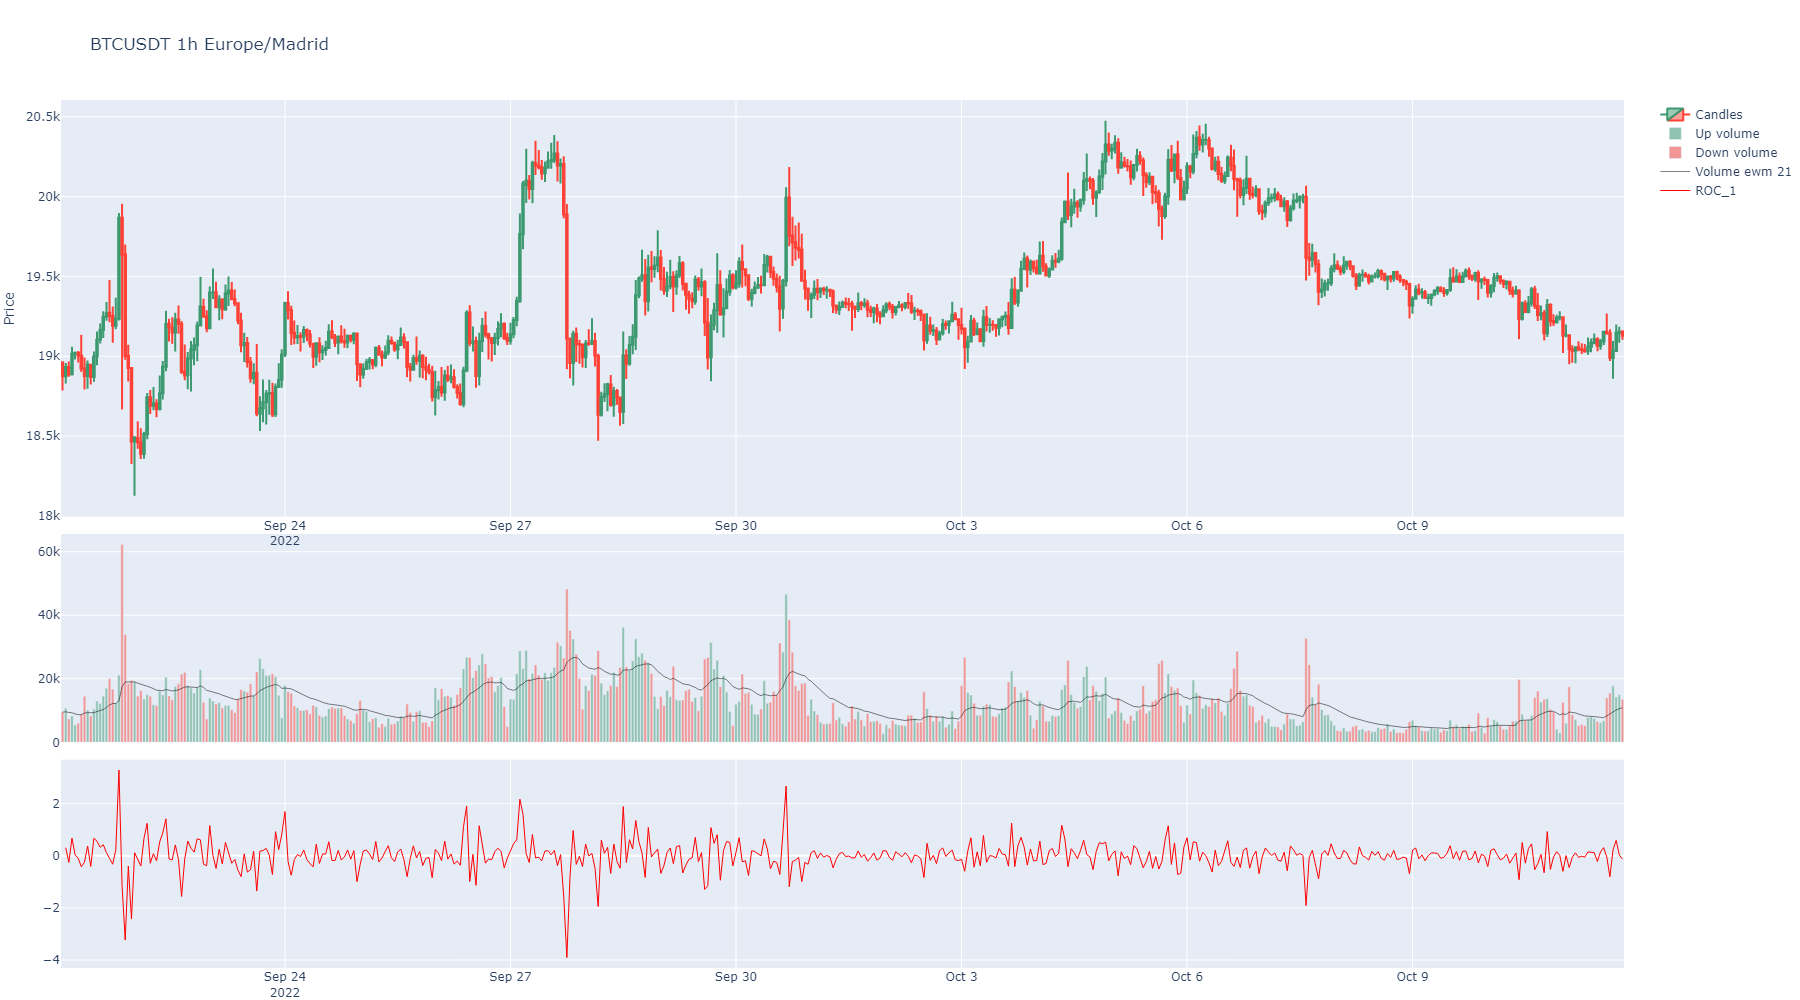
roc([length, escalar, inplace, suffix, color])The Rate of Change (ROC) is a technical indicator that measures the percentage change between the most recent price and the price "n" day's ago.
roi([column])It returns win or loos percent for a evaluation column.
rolling_support_resistance([minutes_window, ...])Calculate support and resistance levels for the Symbol based on either atomic trades or aggregated trades in a rolling window.
rsi([length, inplace, suffix, color])Relative Strength Index (RSI).
set_plot_axis_group([indicator_column, ...])Internal control formatting plots.
set_plot_color([indicator_column, color])Internal control formatting plots.
set_plot_color_fill([indicator_column, ...])Internal control formatting plots.
set_plot_filled_mode([indicator_column, ...])Internal control formatting plots.
set_plot_row([indicator_column, row_position])Internal control formatting plots.
Modify the control for splitted series in plots with colored area in two colors by relative position.
set_plotting_volume_ma([window])Set a window for plotting volume moving average on the candles plot when volumen bars are plotted.
set_strategy_groups(column, group[, ...])Returns strategy_groups for BinPan DataFrame.
shift(column[, window, strategy_group, ...])It shifts a candle ahead by the window argument value (or backwards if negative)
sma([window, column, inplace, suffix, color])Generate technical indicator Simple Moving Average.
stoch([k_length, stoch_d, k_smooth, ...])Stochastic Oscillator with a fast and slow exponential moving averages.
stoch_rsi([rsi_length, k_smooth, d_smooth, ...])Stochastic Relative Strength Index (RSI) with a fast and slow exponential moving averages.
strategy_from_tags_crosses([columns, ...])Checks where all tags and cross columns get value "1" at the same time.
supertrend([length, multiplier, inplace, ...])Generate technical indicator Supertrend.
support_resistance([from_atomic, ...])Calculate support and resistance levels for the Symbol based on either atomic trades or aggregated trades.
tag(column, reference[, relation, ...])It tags values of a column/serie compared to other serie or value by methods gt,ge,eq,le,lt as condition.
time_centroids([from_atomic, ...])Calculate centroids for timestamps of more activity in taker buys or takers sells.
Returns exchangeInfo data when instantiated.
volume_profile([bins, value_area_pct, ...])Volume Profile (VPVR): volumen por nivel de precio + POC, Value Area y nodos HVN/LVN.
vwap([anchor, inplace, suffix, color])Volume Weighted Average Price.
Get exchange info about the symbol for order filters.
Get exchange info about the symbol for order types.
Get exchange info about the symbol for trading permissions.
Get exchange info about the symbol for assets precision.
Return the symbol status, TRADING, BREAK, etc.
get_fees([symbol])Shows applied fees for the symbol of the object.
get_orderbook([limit])Gets orderbook.
- save_csv(timestamped_filename: bool = True) None[source]
Saves current klines DataFrame to a csv file.
- Parameters:
timestamped_filename (bool) – Adds start and end timestamps to the name.
- Returns:
None
- save_atomic_trades_csv(timestamped_filename: bool = True) None[source]
Saves current atomic trades to a csv file.
- Parameters:
timestamped_filename (bool) – Adds start and end timestamps to the name.
- Returns:
None
- save_agg_trades_csv(timestamped_filename: bool = True) None[source]
Saves current aggregated trades to a csv file.
- Parameters:
timestamped_filename (bool) – Adds start and end timestamps to the name.
- Returns:
None
- set_display_max_columns(display_columns=None) None[source]
Method to change the maximum number of columns shown in the display of the dataframe. Uses pandas options.
- Parameters:
display_columns (int) – Integer
- Returns:
None
- set_display_min_rows(display_min_rows=None) None[source]
Method to change the number of minimum rows shown in the display of the dataframe. Uses pandas options.
- Parameters:
display_min_rows (int) – Integer
- set_display_max_rows(display_max_rows=None) None[source]
Method to change the number of maximum rows shown in the display of the dataframe. Uses pandas options.
- Parameters:
display_max_rows (int) – Integer
- set_display_width(display_width: int = None) None[source]
Method to change the width shown in the display of the dataframe. Uses pandas options.
- Parameters:
display_width (int) – Integer
- static set_display_decimals(display_decimals: int) None[source]
Method to change the number of decimals shown in the display of the dataframe. Uses pandas options.
- Parameters:
display_decimals (int) – Integer
- basic(exceptions: list = None, actions_col='actions') DataFrame[source]
Shows just a basic selection of columns data in the dataframe.
- drop(columns_to_drop=None, inplace=False) DataFrame[source]
It drops some columns from the dataframe. If columns list not passed, then defaults to the initial columns.
Can be used when messing with indicators to clean the object.
- Param:
list columns: A list with the columns names to drop. If not passed, it defaults to the initial columns that remain from when instanced. Defaults to any column but initial ones.
- Param:
bool inplace: When true, it drops columns in the object. False just returns a copy without that columns and dataframe in the object remains.
- Return pd.DataFrame:
Pandas DataFrame with columns dropped.
- delete_indicator_family(indicator_name_root: str) DataFrame | None[source]
Deletes indicator from dataframe. It search for plot info and also deletes other indicators in the same plot row level.
- Parameters:
indicator_name_root (str) – Starting characters for the columns to delete. Case-insensitive.
- Returns:
Resulting main dataframe.
- insert_indicator(source_data: Series | DataFrame | ndarray | list, strategy_group: str | None = None, plotting_row: int | None = None, plotting_rows: list[int] | None = None, color: str | None = None, no_overlapped_plot_rows: bool = True, colors: list[str] | None = None, color_fills: list[str | bool] | None = None, name: str | None = None, names: list[str] | None = None, suffix: str = '') DataFrame | None[source]
Adds one or more indicators to the DataFrame in place.
- Parameters:
source_data – The source data for the indicator(s). Can be a Series, DataFrame, ndarray, or list thereof.
strategy_group – (Optional) Name of the strategy group to tag the inserted data.
plotting_row – (Optional) The specific row for plotting a single series. ‘1’ overlaps with candles; other values create new rows.
plotting_rows – (Optional) List of rows for plotting each series. ‘1’ means overlap; other integers determine separate row positions.
color – (Optional) Color for plotting a single series.
no_overlapped_plot_rows – If True, avoids overlapping plot rows for multiple series.
colors – (Optional) List of colors for each series indicator. Defaults to random colors if not provided.
color_fills – (Optional) List of color fills (as strings) or False to avoid filling. Example: ‘rgba(26,150,65,0.5)’.
name – (Optional) Name for a single inserted object.
names – (Optional) List of names for each column when multiple indicators are inserted.
suffix – Suffix to add to the new column name(s). If the source data is nameless, the suffix becomes the entire name.
- Returns:
The modified DataFrame with new indicators added, or None if the operation fails.
Note: This function dynamically assigns plotting rows and colors if they are not explicitly provided. It handles different types of input data for indicators and integrates them into the existing DataFrame.
- hk(inplace=False) DataFrame[source]
It computes Heikin Ashi candles. Any existing indicator column will not be recomputed. It is recommended to drop any indicator before converting candles to Heikin Ashi.
- Parameters:
inplace (bool) – Change object dataframe permanently whe True is selected. False shows a copy dataframe.
- Return pd.DataFrame:
Pandas DataFrame
- get_timestamps() tuple[int, int][source]
Get the first Open timestamp and the last Open timestamp.
- Return tuple[int, int]:
Tuple of (start_ms, end_ms) open timestamps.
- get_dates() tuple[str, str][source]
Get the first Open timestamp and the last Open timestamp, and converts to timezoned dates.
- Return tuple[str, str]:
Tuple of (start_date, end_date) as formatted strings.
- get_agg_trades(hours: int = None, minutes: int = None, startTime: int | str = None, endTime: int | str = None, time_zone: str = None, from_csv: str = None) Trades[source]
Calls the API and creates another dataframe included in the object with the aggregated trades from API for the period of the created object.
Note
If the object covers a long time interval, this action can take a relative long time. The BinPan library take care of the API weight and can take a sleep to wait until API weight returns to a low value. This avoids ban from the API.
- Parameters:
hours (int) – If passed, it use just last passed hours for the plot.
minutes (int) – If passed, it use just last passed minutes for the plot.
startTime (int or str) – If passed, it use just from the timestamp or date in format (%Y-%m-%d %H:%M:%S: 2022-05-11 06:45:42)) for the plot.
endTime (int or str) – If passed, it use just until the timestamp or date in format (%Y-%m-%d %H:%M:%S: 2022-05-11 06:45:42)) for the plot.
time_zone (str) – A time zone for time index conversion. Example: “Europe/Madrid”
from_csv (str) – If set, loads from a file.
- Returns:
Pandas DataFrame
- get_atomic_trades(hours: int = None, minutes: int = None, startTime: int | str = None, endTime: int | str = None, time_zone: str = None, from_csv: str = None) Trades[source]
Calls the API and creates another dataframe included in the object with the atomic trades from API for the period of the created object.
Note
If the object covers a long time interval, this action can take a relative long time. The BinPan library take care of the API weight and can take a sleep to wait until API weight returns to a low value.
- Parameters:
hours (int) – If passed, it use just last passed hours for the plot.
minutes (int) – If passed, it use just last passed minutes for the plot.
startTime (int or str) – If passed, it use just from the timestamp or date in format (%Y-%m-%d %H:%M:%S: 2022-05-11 06:45:42)) for the plot.
endTime (int or str) – If passed, it use just until the timestamp or date in format (%Y-%m-%d %H:%M:%S: 2022-05-11 06:45:42)) for the plot.
time_zone (str) – A time zone for time index conversion. Example: “Europe/Madrid”
from_csv (str) – If set, loads from a file.
- Returns:
Pandas DataFrame
- is_new(source_data: Series | DataFrame, suffix: str = '') bool[source]
Verify if indicator columns are previously created to avoid allocating new rows and colors etc.
- Parameters:
source_data (pd.Series or pd.DataFrame) – Data from pandas_ta to review if is previously computed.
suffix (str) – If suffix passed, it takes it into account when searching for existence.
- Return bool:
- get_reversal_agg_candles(min_height: int = 7, min_reversal: int = 4) DataFrame | None[source]
- Resamples aggregated API trades to reversal klines:
- Parameters:
min_height – Defaults to 7. Minimum reversal kline height to close a candle
min_reversal – Defaults to 4. Minimum reversal from hig/low to close a candle
- Return pd.DataFrame:
Resample trades to reversal klines. Can be plotted.
- get_reversal_atomic_candles(min_height: int = 7, min_reversal: int = 4) DataFrame | None[source]
- Resamples API atomic trades to reversal klines:
- Parameters:
min_height – Defaults to 7. Minimum reversal kline height to close a candle
min_reversal – Defaults to 4. Minimum reversal from hig/low to close a candle
- Return pd.DataFrame:
Resample trades to reversal klines. Can be plotted.
- resample(tick_interval: str, inplace=False) DataFrame | None[source]
Resample trades to a different tick interval. Tick interval must be higher. :param str tick_interval: A binance tick interval. Must be higher than current tick interval. :param bool inplace: Change object dataframe permanently whe True is selected. False shows a copy dataframe. :return pd.DataFrame: Resampled klines.
- repair_continuity() None[source]
Repair kline discontinuities by filling missing candles.
Updates the instance DataFrame in place and re-checks continuity.
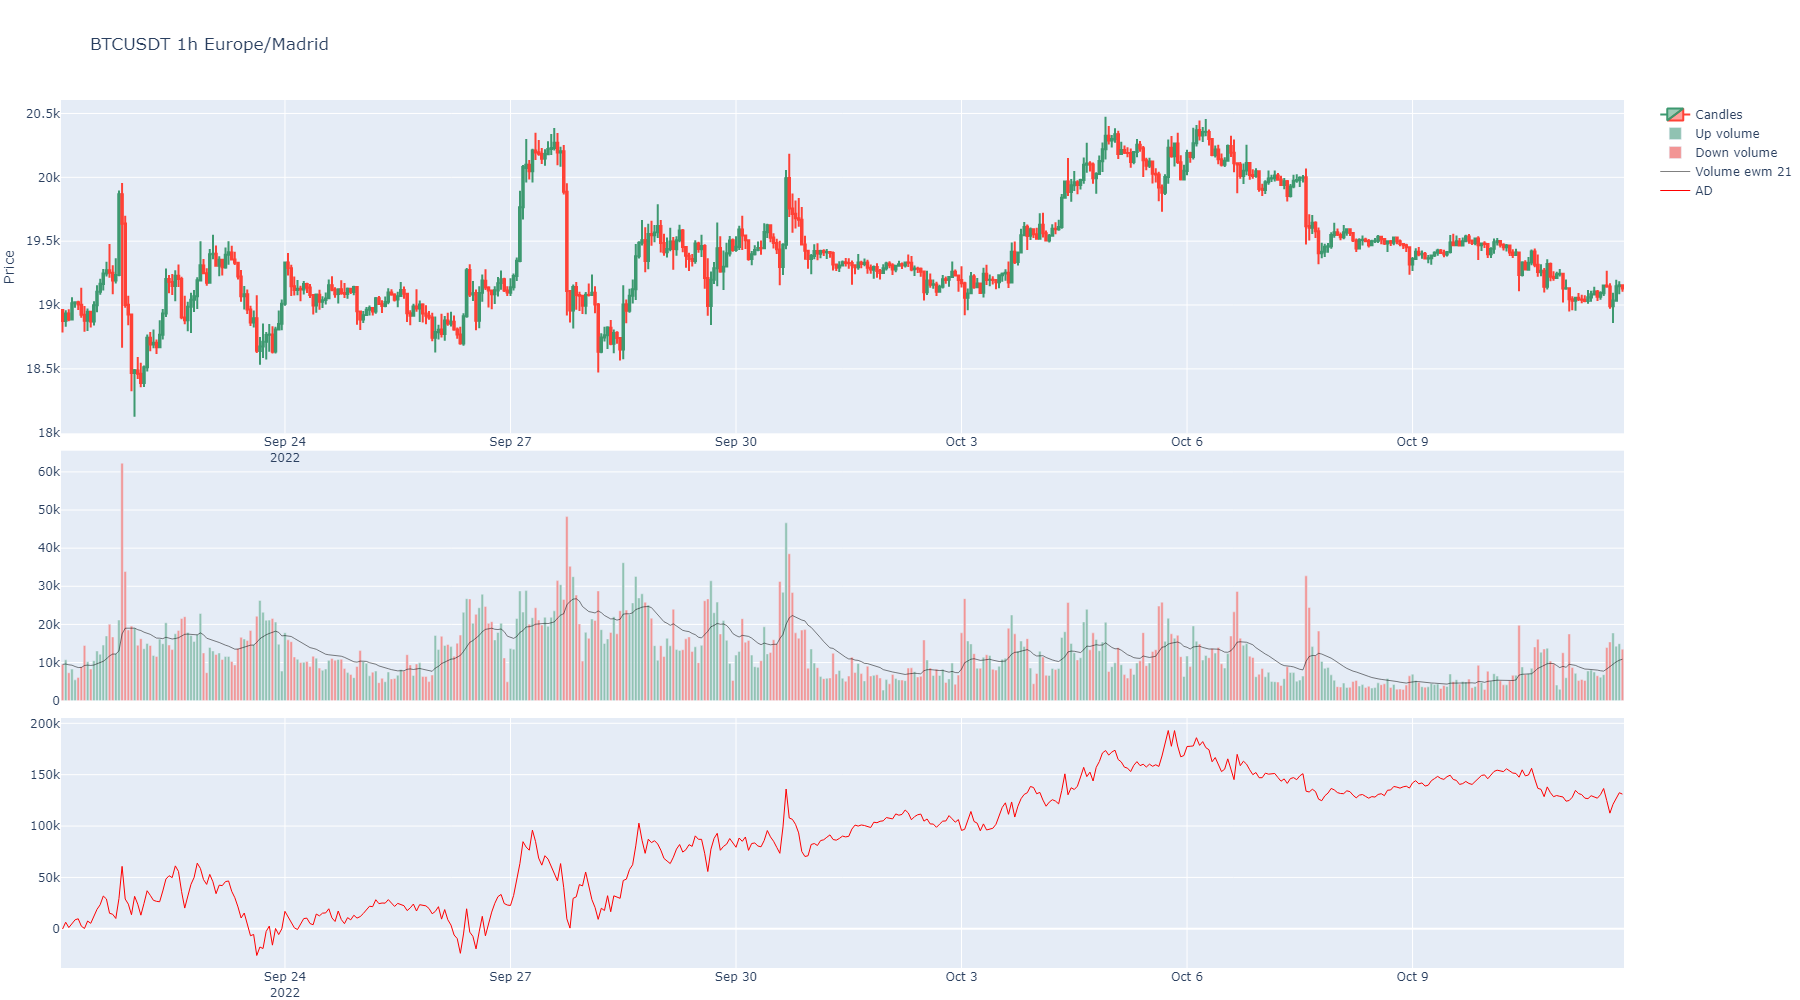
- accumulation_distribution(inplace: bool = True, suffix: str = '', color: str | int = None, **kwargs) Series
Accumulation/Distribution indicator.
- Parameters:
inplace (bool) – Make it permanent in the instance or not.
suffix (str) – A decorative suffix for the name of the column created.
color (str or int) – Is the color to show when plotting or index in that list.
kwargs – Optional from https://github.com/twopirllc/pandas-ta/blob/main/pandas_ta/volume/ad.py
- Returns:
A Pandas Series
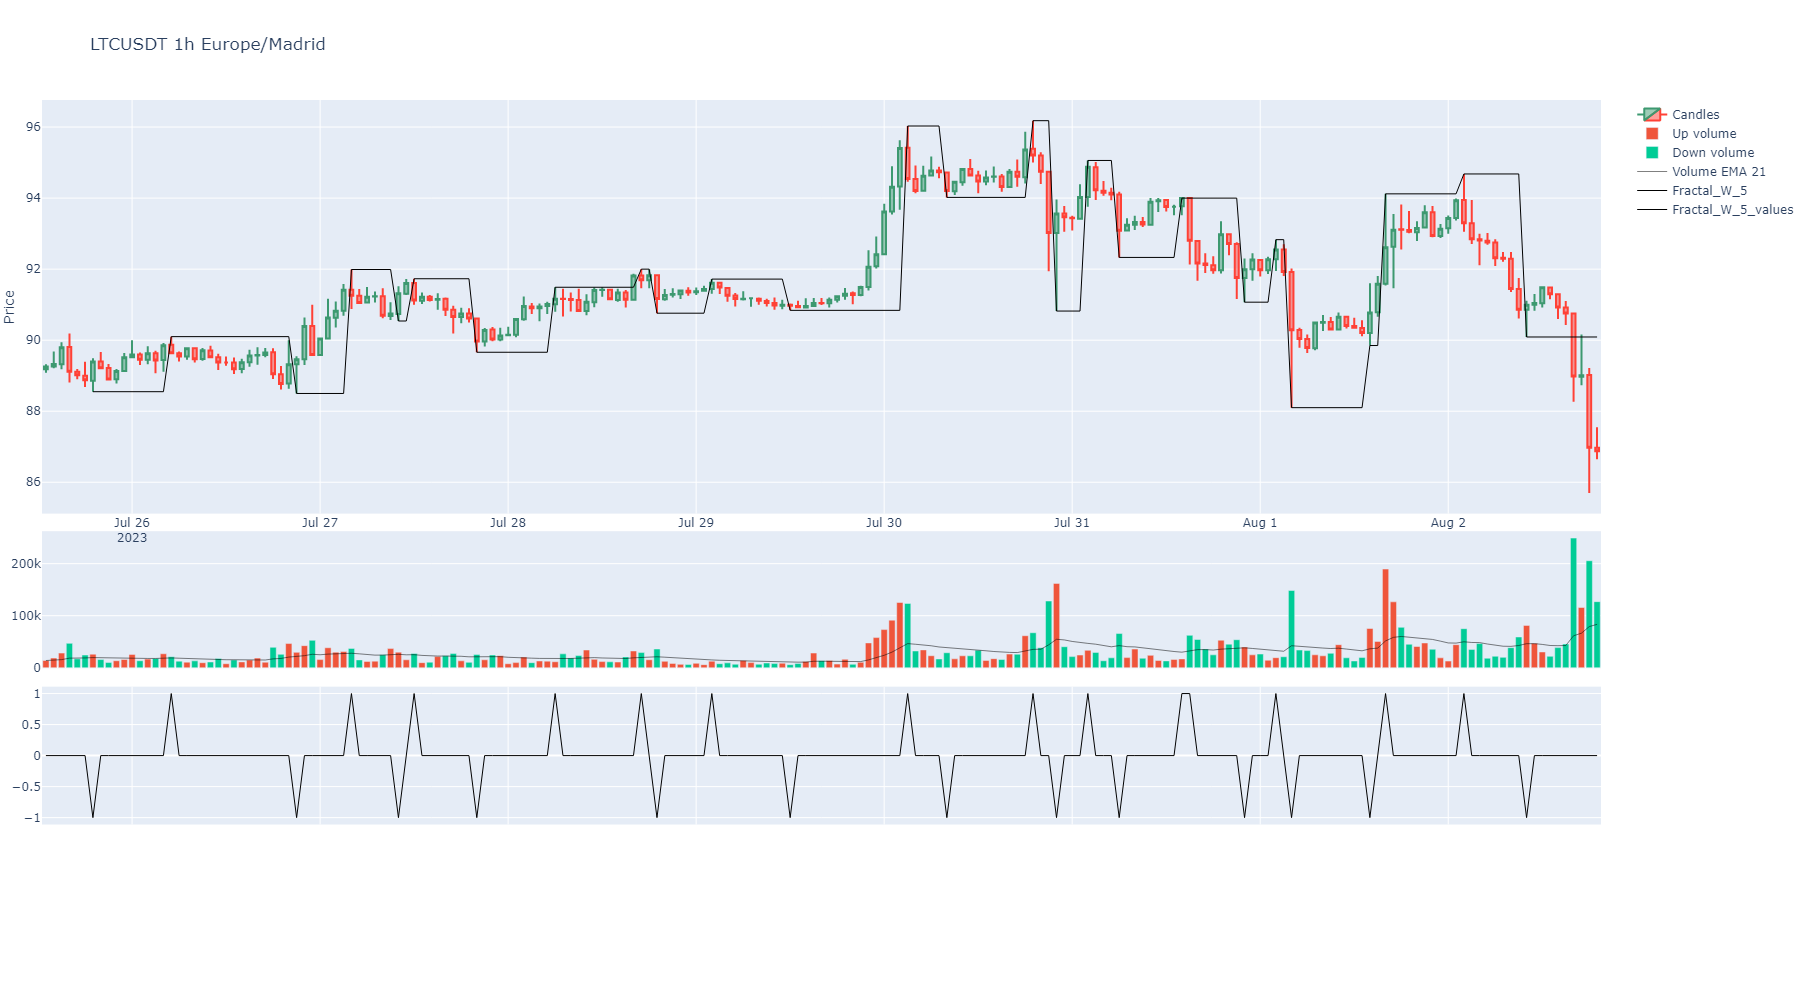
- alternating_fractal(max_period: int = None, inplace: bool = True, overlap_plot=True, with_trend: bool = True, suffix: str = '', colors: list = None) tuple[Series | None, float | None, float | None]
Obtains the minim value for fractal_w periods as fractal is pure alternating from max to min to max etc. In other words, max and mins alternates in regular rhythm without any tow max or two mins consecutively.
This custom indicator shows the minimum period in finding a pure alternating fractal. It is some kind of rhythm in price indicator, the most period needed, the slow price rhythm.
- Parameters:
max_period (int) – Default is len of dataframe. This method will check from 2 to the max period value to find a alternating max to mins.
inplace (bool) – Make it permanent in the instance or not.
overlap_plot (bool) – If True, it will overlap the indicator plot with the price plot.
with_trend (bool) – If true, it will return maximums diff mean and minimums diff mean also.
suffix (str) – A decorative suffix for the name of the column created.
colors (list) – A list of colors for the indicator dataframe columns. Is the color to show when charts. It can be any color from plotly library or a number in the list of those. Default colors defined. https://community.plotly.com/t/plotly-colours-list/11730
- Return pd.DataFrame:
A dataframe with two columns, one with 1 or -1 for local max or local min to tag, and other with price values for that points. Alternatively, maximums and minimums diff mean will be returned.
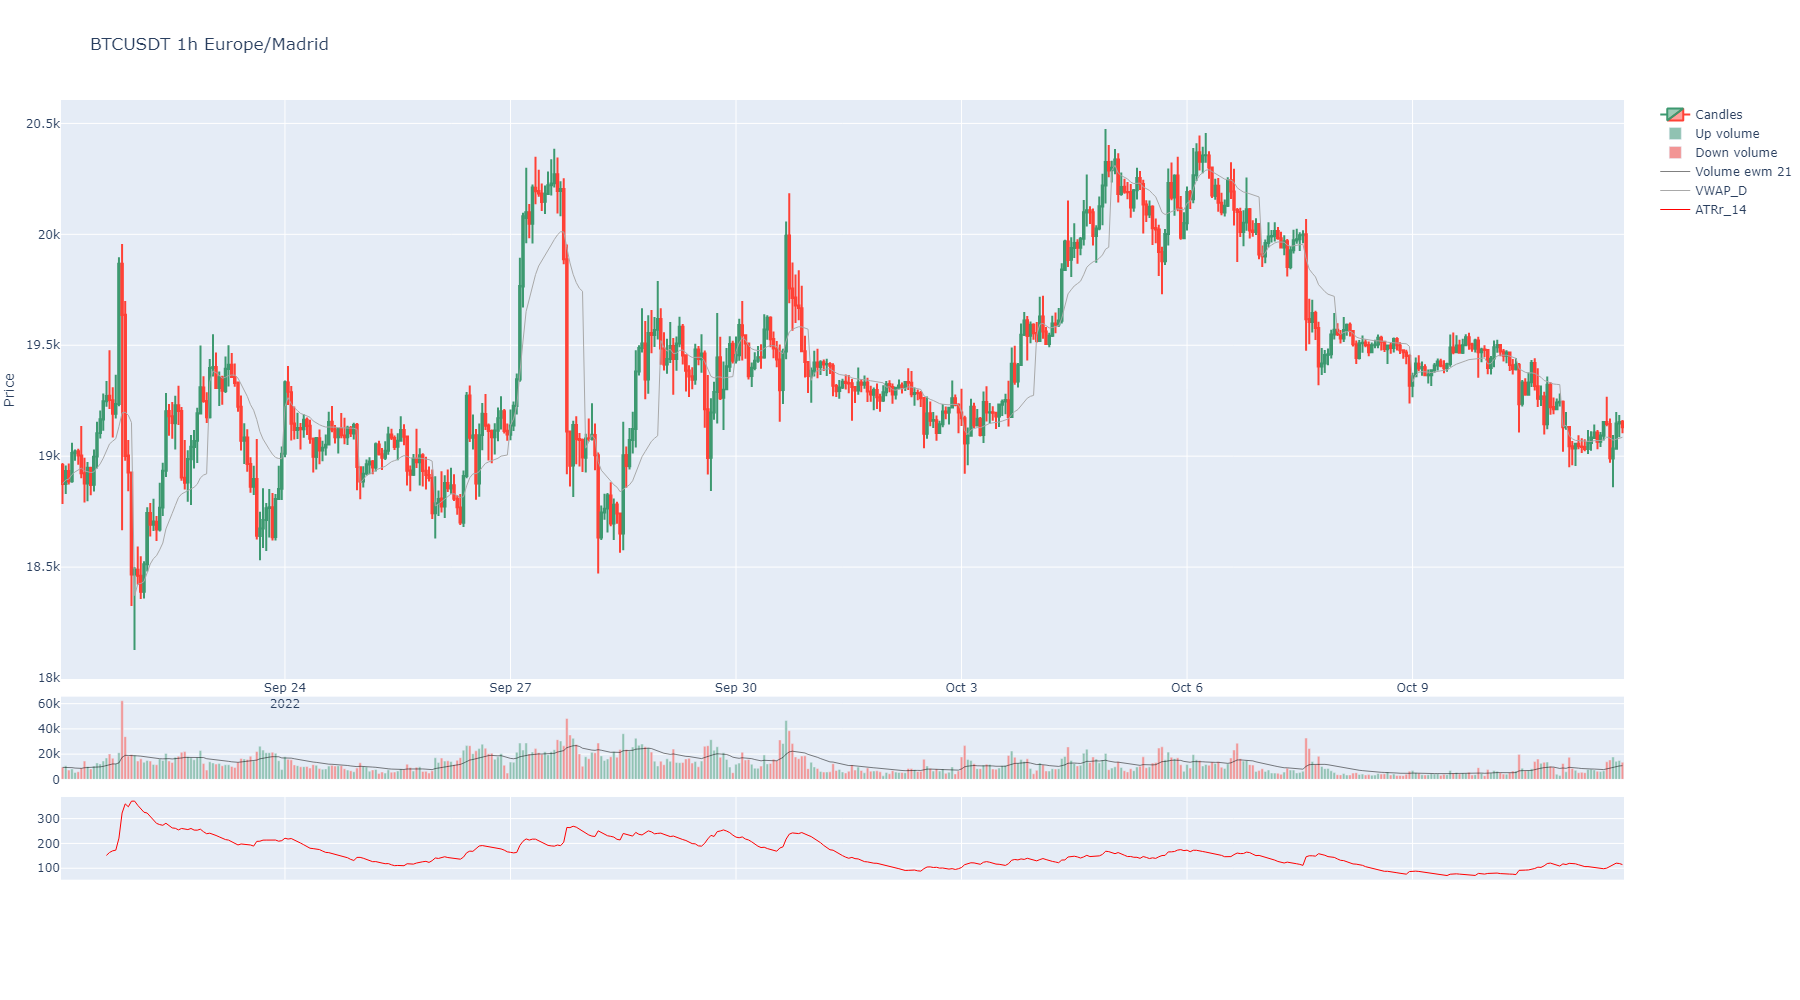
- atr(length: int = 14, inplace: bool = True, suffix: str = '', color: str | int = None, **kwargs) Series
Average True Range.
- Parameters:
length (str) – Window period to obtain ATR. Default is 14.
inplace (bool) – Make it permanent in the instance or not.
suffix (str) – A decorative suffix for the name of the column created.
color (str or int) – Is the color to show when plotting or index in that list.
kwargs – Optional from https://github.com/twopirllc/pandas-ta/blob/main/pandas_ta/volatility/atr.py
- Returns:
A Pandas Series
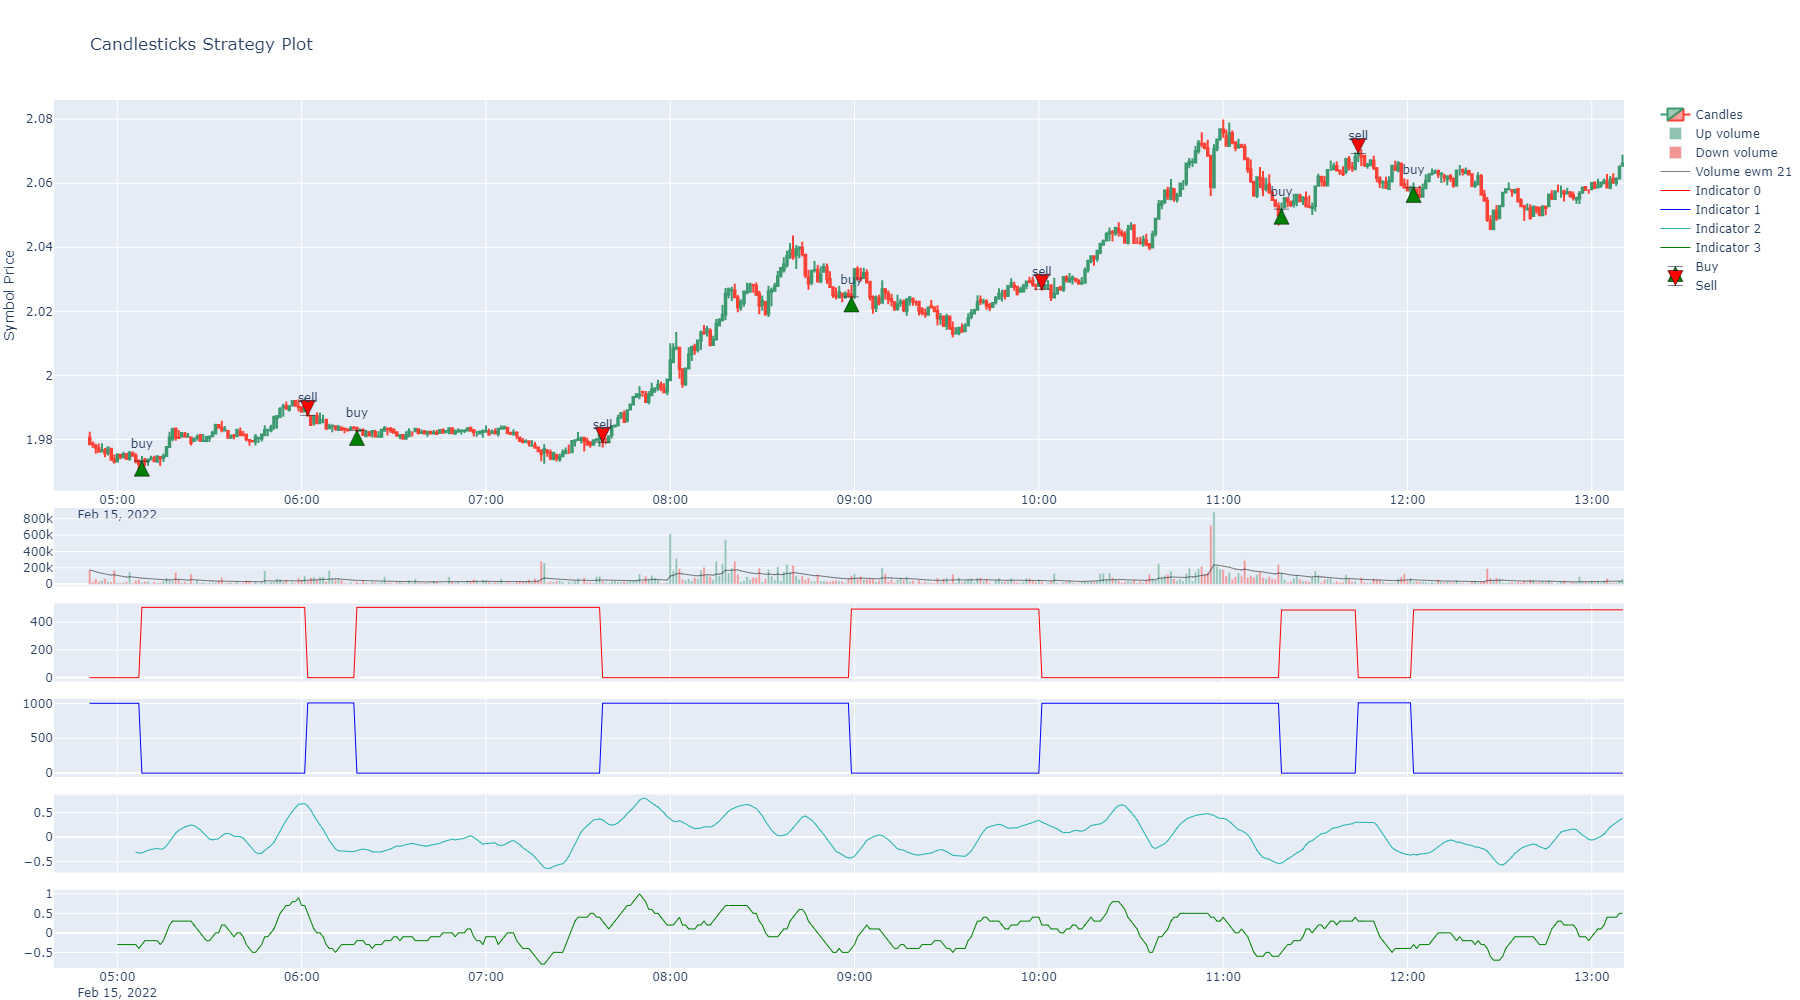
- backtesting(actions_col: str | int, target_column: str | Series = None, stop_loss_column: str | Series = None, entry_filter_column: str | Series = None, fixed_target: bool = True, fixed_stop_loss: bool = True, base: float = 0, quote: float = 1000, priced_actions_col: str = 'Open', label_in=1, label_out=-1, fee: float = 0.001, evaluating_quote: str = None, short: bool = False, inplace=True, suffix: str = None, colors: list = None) DataFrame | Series
Simulates buys and sells using labels in a tagged column with actions. Actions are considered before the tag, in the next candle using priced_actions_col price of that candle before.
- Parameters:
target_column – Column with data for operation target values.
stop_loss_column – Column with data for operation stop loss values.
entry_filter_column (pd.Series | str) – A serie or colum with ones or zeros to allow or avoid entries.
fixed_target (bool) – Target for any operation will be calculated and fixed at the beginning of the operation.
fixed_stop_loss (bool) – Stop loss for any operation will be calculated and fixed at the beginning of the operation.
base (float) – Base inverted quantity.
quote (float) – Quote inverted quantity.
priced_actions_col (str | int) – Columna name or index with prices to use when action label in a row.
label_in (str | int) – A label consider as trade in trigger.
label_out (str | int) – A label consider as trade out trigger.
fee (float) – Fees applied to the simulation.
evaluating_quote (str) – A quote used to convert value of the backtesting line for better reference.
short (bool) – Backtest in short mode, with in as shorts and outs as repays.
inplace (bool) – Make it permanent in the instance or not.
suffix (str) – A decorative suffix for the name of the column created.
colors (list) – Defaults to red and green.
- Return pd.DataFrame | pd.Series:
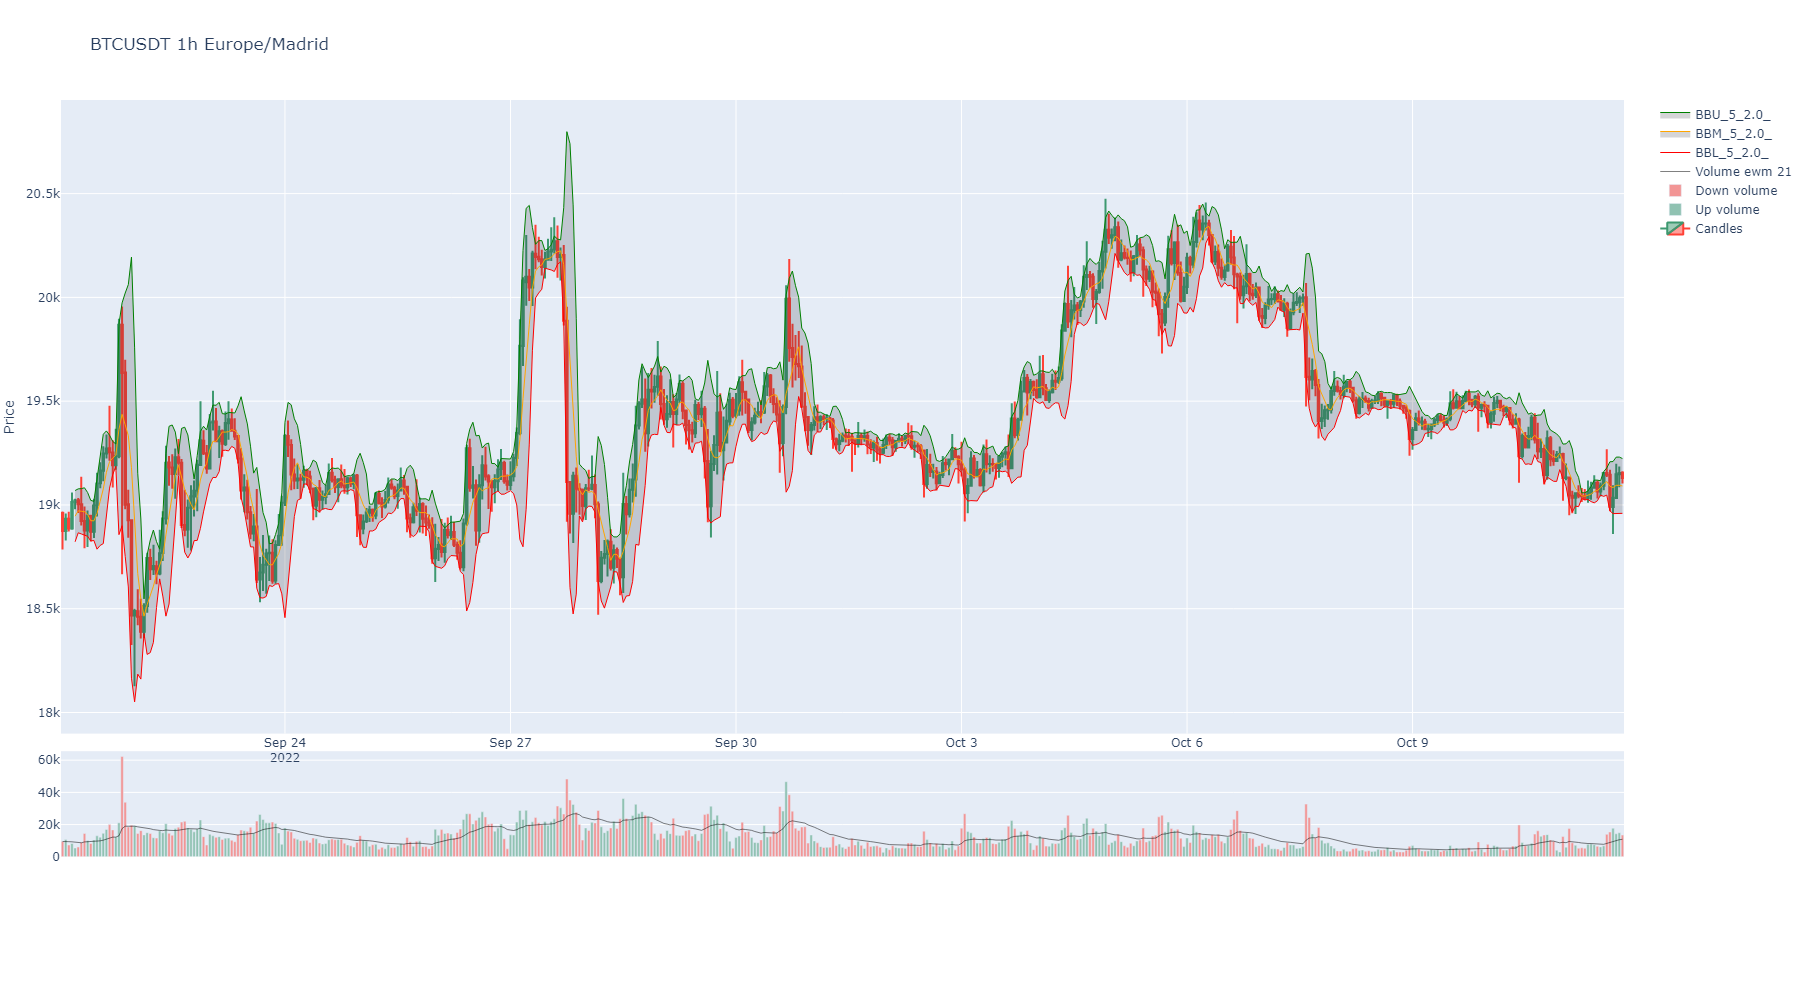
- bbands(length: int = 5, std: int = 2, ddof: int = 0, inplace: bool = True, suffix: str = '', colors: list = None, my_fill_color: str = 'rgba(47, 48, 56, 0.2)', **kwargs) DataFrame
These bands consist of an upper Bollinger band and a lower Bollinger band and are placed two standard deviations above and below a moving average. Bollinger bands expand and contract based on the volatility. During a period of rising volatility, the bands widen, and they contract as the volatility decreases. Prices are considered to be relatively high when they move above the upper band and relatively low when they go below the lower band.
- Parameters:
length (int) – The short period. Default: 5
std (int) – The long period. Default: 2
ddof (int) – Degrees of Freedom to use. Default: 0
inplace (bool) – Make it permanent in the instance or not.
suffix (str) – A decorative suffix for the name of the column created.
colors (list) – A list of colors for the indicator dataframe columns. Is the color to show when charts. It can be any color from plotly library or a number in the list of those. Default colors defined. https://community.plotly.com/t/plotly-colours-list/11730
my_fill_color (str) – An rgba color code to fill between bands area. https://rgbacolorpicker.com/
kwargs – Optional from https://github.com/twopirllc/pandas-ta/blob/main/pandas_ta/volatility/bbands.py
- Returns:
pd.Series
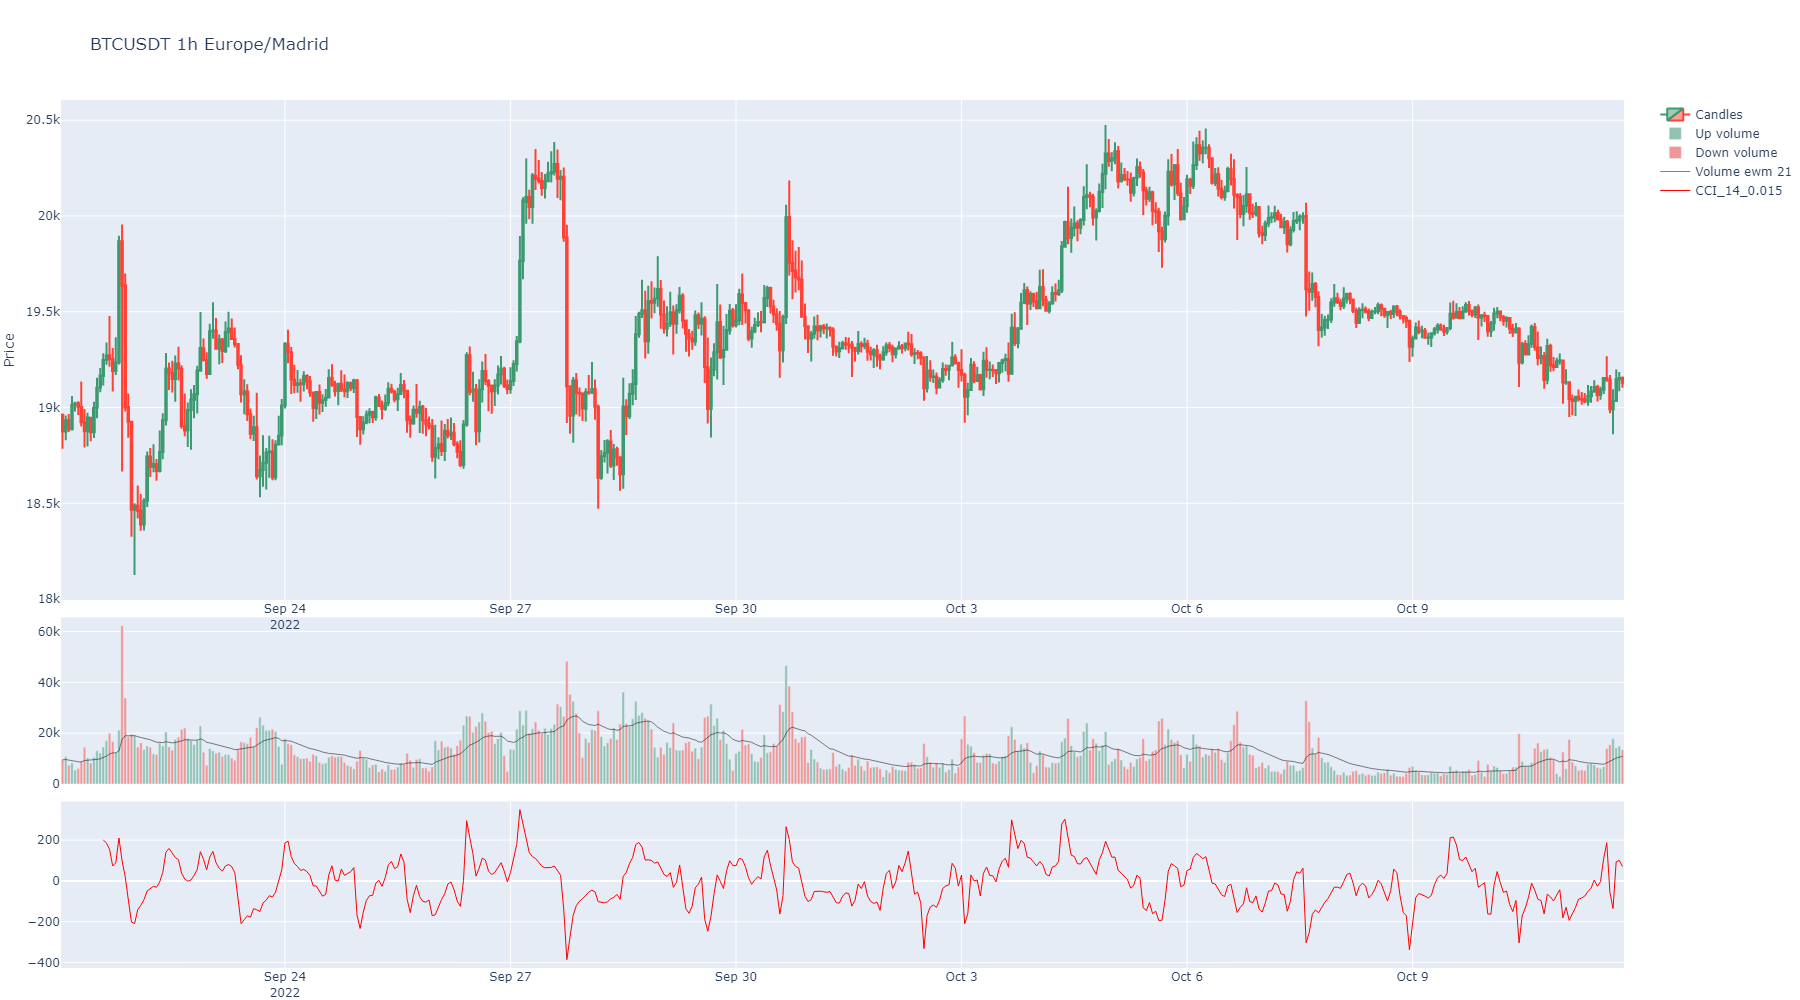
- cci(length: int = 14, scaling: int = None, inplace: bool = True, suffix: str = '', color: str | int = None, **kwargs) Series
Compute the Commodity Channel Index (CCI) for NIFTY based on the 14-day moving average. CCI can be used to determine overbought and oversold levels.
Readings above +100 can imply an overbought condition
Readings below −100 can imply an oversold condition.
However, one should be careful because security can continue moving higher after the CCI indicator becomes overbought. Likewise, securities can continue moving lower after the indicator becomes oversold.
- Parameters:
length (str) – Window period to obtain ATR. Default is 14.
scaling (str) – Scaling Constant. Default: 0.015.
inplace (bool) – Make it permanent in the instance or not.
suffix (str) – A decorative suffix for the name of the column created.
color (str or int) – Is the color to show when plotting or index in that list.
kwargs – Optional from https://github.com/twopirllc/pandas-ta/blob/main/pandas_ta/momentum/cci.py
- Returns:
A Pandas Series
- clean_in_out(column: str | int | Series, in_tag=1, out_tag=-1, strategy_group: str = '', inplace=True, suffix: str = '', color: str | int = 'grey') Series
It cleans a serie with in and out tags by eliminating in streaks and out streaks.
Same kind of index needed.
- Parameters:
column (pd.Series) – A column to clean in and out values.
in_tag – Tag for in tags. Default is 1.
out_tag – Tag for out tags. Default is -1.
strategy_group (str) – A name for a group of columns to assign to a strategy.
inplace (bool) – Permanent or not. Default is false, because of some testing required sometimes.
suffix (str) – A string to decorate resulting Pandas series name.
color (str | int) – A color from plotly list of colors or its index in that list.
- Return pd.Series:
A merged serie.
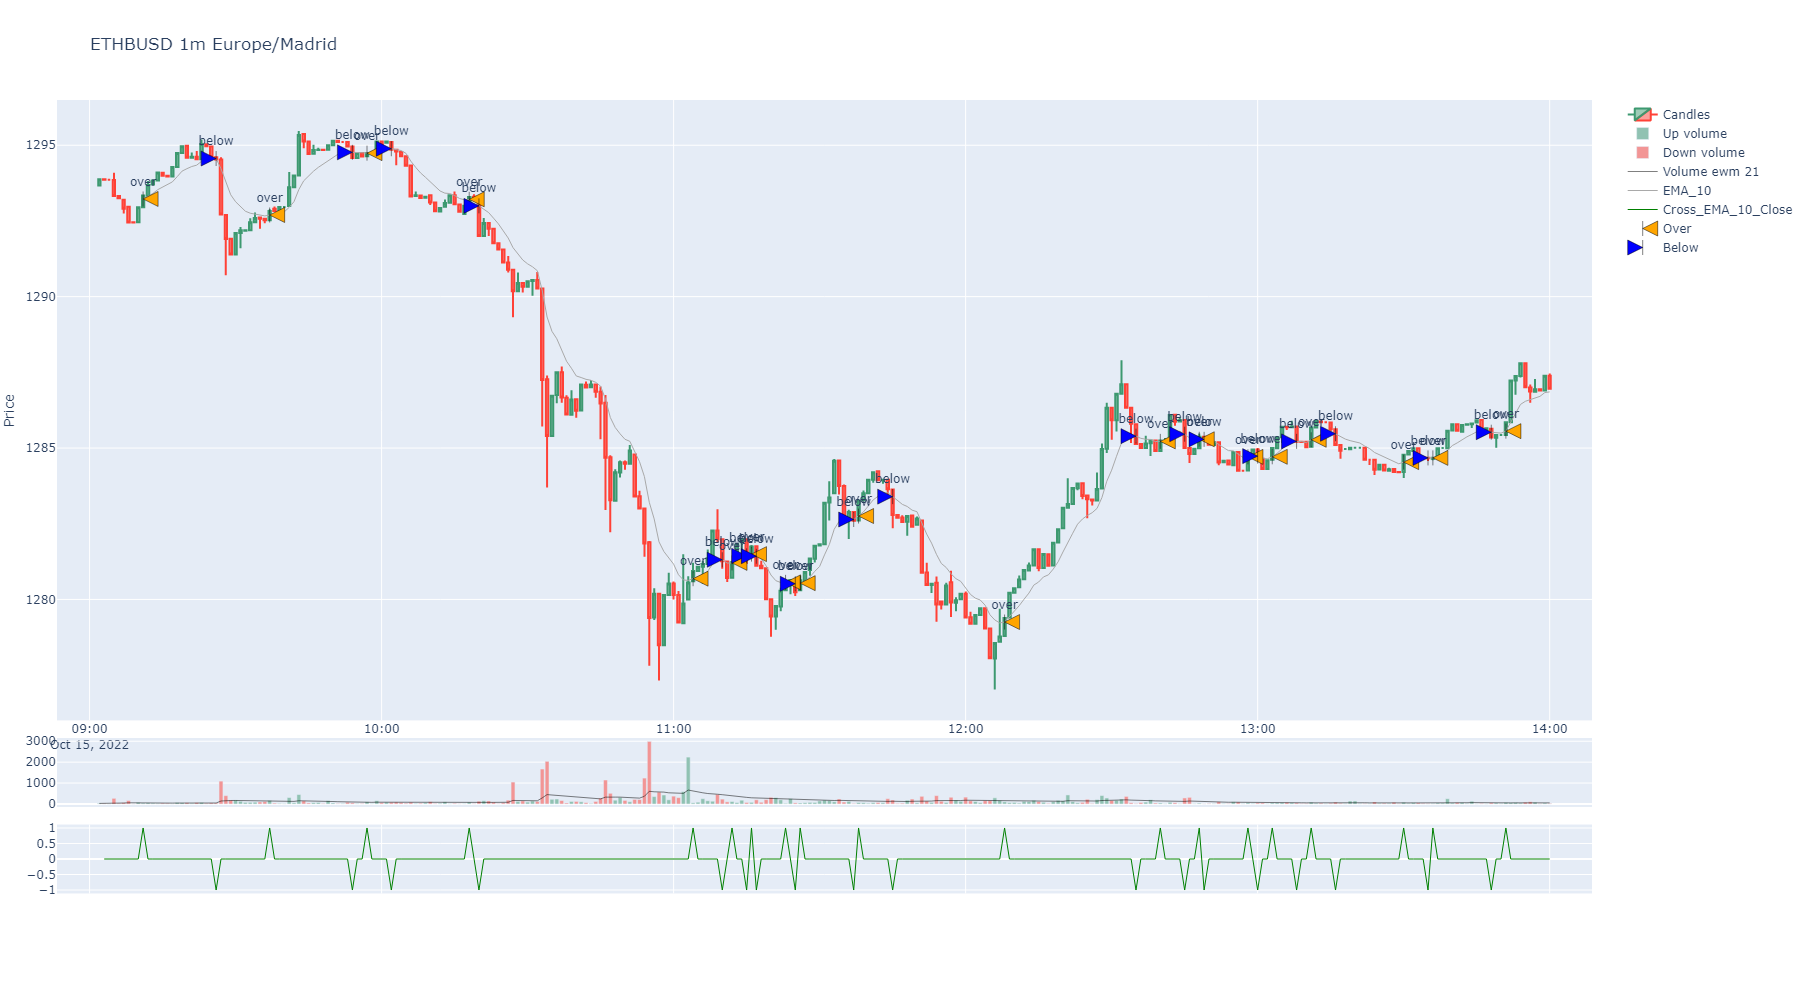
- cross(slow: str | int | float | Series, fast: str | int | Series = 'Close', cross_over_tag: str | int = 1, cross_below_tag: str | int = -1, echo=0, non_zeros: bool = True, strategy_group: str = None, inplace=True, suffix: str = '', color: str | int = 'green') Series
It tags crossing values from a column/serie (fast) over a serie or value (slow).
- Parameters:
slow (pd.Series | str | int | float) – A number or numeric serie or column name.
fast (pd.Series | str) – A numeric serie or column name or column index. Default is Close price.
cross_over_tag (int | str) – Value or string to tag matched crossing fast over slow.
cross_below_tag (int | str) – Value or string to tag crossing slow over fast.
non_zeros (bool) – Result will not contain zeros as non tagged values, instead will be nans.
echo (int) – It tags a fixed amount of candles forward the crossed point not including cross candle. If echo want to be used, must be used non_zeros.
strategy_group (str) – A name for a group of columns to assign to a strategy.
inplace (bool) – Permanent or not. Default is false, because of some testing required sometimes.
suffix (str) – A string to decorate resulting Pandas series name.
color (str | int) – A color from plotly list of colors or its index in that list.
- Return pd.Series:
A serie with tags as values. 1 and -1 for both crosses.
import binpan

sym = binpan.Symbol(symbol='ethbusd', tick_interval='1m', limit=300, time_zone='Europe/Madrid')
sym.ema(window=10, color='darkgrey')

sym.cross(slow='Close', fast='EMA_10')

sym.plot(actions_col='Cross_EMA_10_Close', priced_actions_col='EMA_10',
                 labels=['over', 'below'],
                 markers=['arrow-bar-left', 'arrow-bar-right'],
                 marker_colors=['orange', 'blue'])
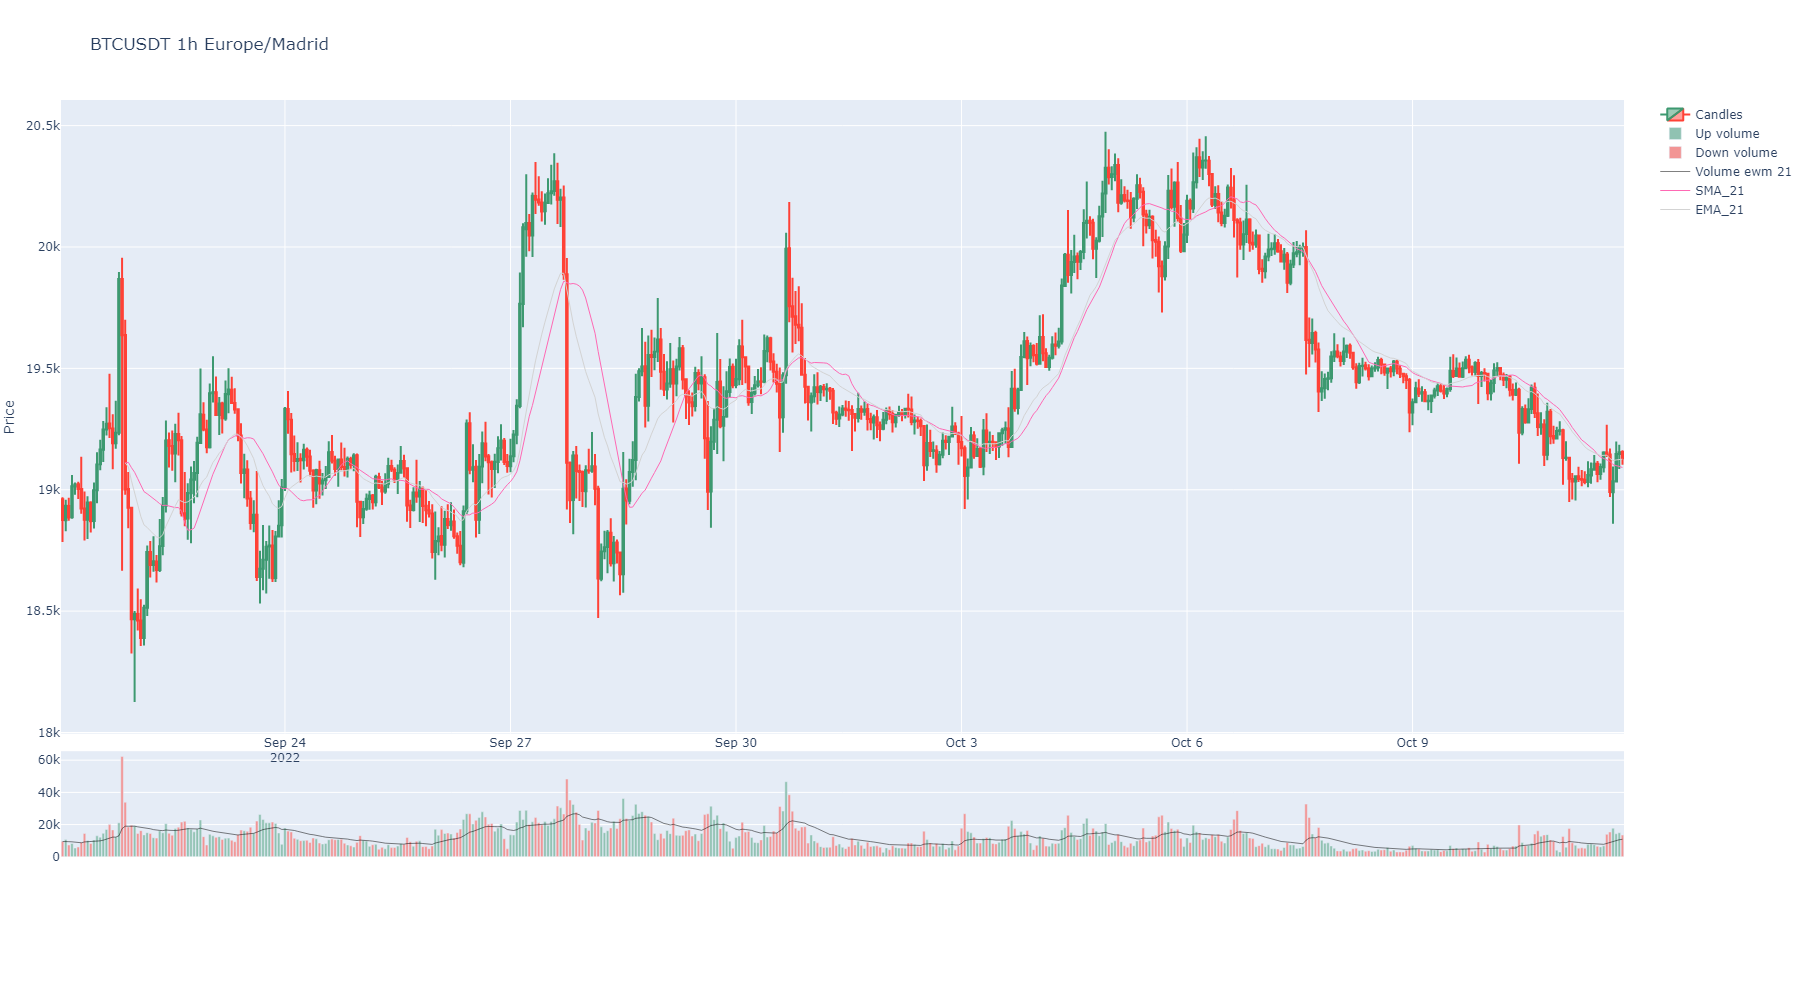
- ema(window: int = 21, column: str = 'Close', inplace=True, suffix: str = '', color: str | int = None, **kwargs) Series
Generate technical indicator Exponential Moving Average.
- Parameters:
window (int) – Rolling window including the current candles when calculating the indicator.
column (str) – Column applied. Default is Close.
inplace (bool) – Make it permanent in the instance or not.
suffix (str) – A decorative suffix for the name of the column created.
color (str or int) – Color to show when charts. It can be any color from plotly library or index number in that list. <https://community.plotly.com/t/plotly-colours-list/11730>
kwargs – Optional plotly args from https://github.com/twopirllc/pandas-ta/blob/main/pandas_ta/overlap/ema.py
- Returns:
pd.Series
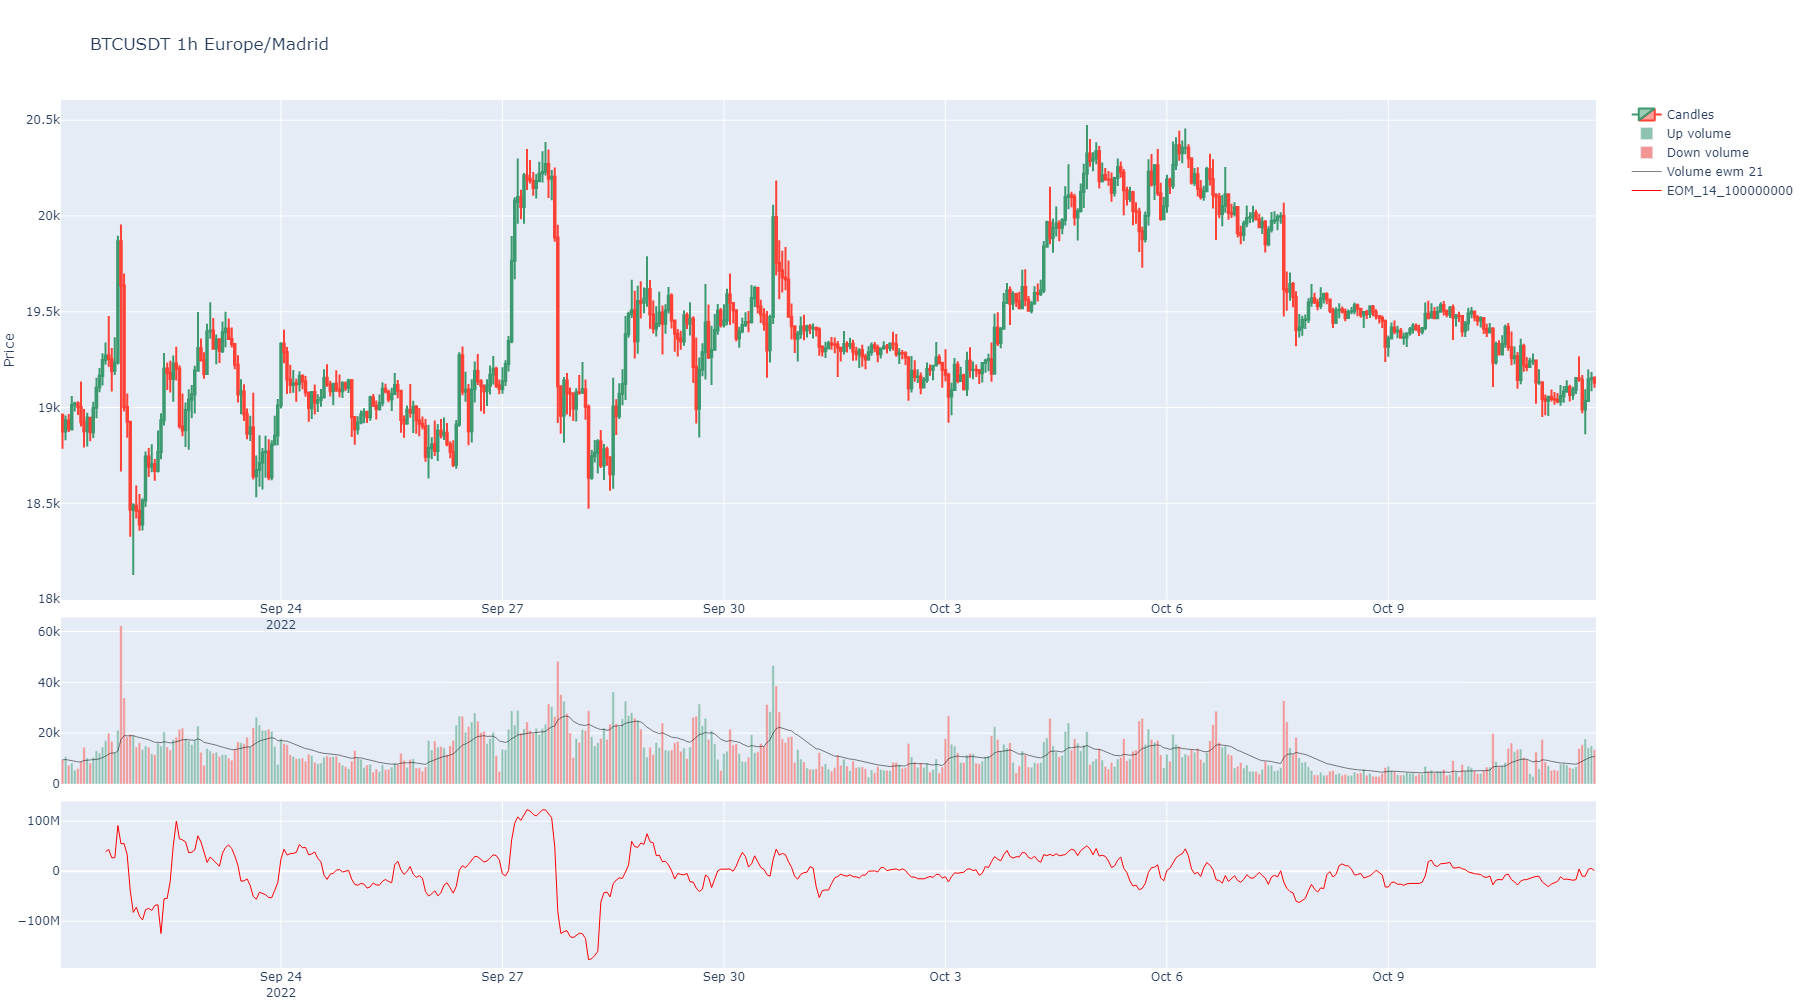
- eom(length: int = 14, divisor: int = 100000000, drift: int = 1, inplace: bool = True, suffix: str = '', color: str | int = None, **kwargs) Series
Ease of Movement (EMV) can be used to confirm a bullish or a bearish trend. A sustained positive Ease of Movement together with a rising market confirms a bullish trend, while a negative Ease of Movement values with falling prices confirms a bearish trend. Apart from using as a standalone indicator, Ease of Movement (EMV) is also used with other indicators in chart analysis.
- Parameters:
length (str) – The short period. Default: 14
divisor (str) – Scaling Constant. Default is 100000000.
drift (str) – The diff period. Default is 1
inplace (bool) – Make it permanent in the instance or not.
suffix (str) – A decorative suffix for the name of the column created.
color (str or int) – Is the color to show when plotting or index in that list.
kwargs – Optional from https://github.com/twopirllc/pandas-ta/blob/main/pandas_ta/volume/eom.py
- Returns:
A Pandas Series
- ffill_window(column: str | int | Series, window: int = 1, inplace=True, replace=False, suffix: str = '', color: str | int = 'blue')
It forward fills a value through nans a window ahead.
- Parameters:
window (int) – Times values are shifted ahead. Default is 1.
replace (bool) – Permanent replace for a column with results.
inplace (bool) – Permanent or not. Default is false, because of some testing required sometimes.
suffix (str) – A string to decorate resulting Pandas series name.
color (str | int) – A color from plotly list of colors or its index in that list.
- Return pd.Series:
A series with index adjusted to the new shifted positions of values.
- fractal(period: int = 5, inplace: bool = True, overlap_plot=True, suffix: str = '', colors: list = None) DataFrame
The fractal indicator is based on a simple price pattern that is frequently seen in financial markets. Outside of trading, a fractal is a recurring geometric pattern that is repeated on all time frames. From this concept, the fractal indicator was devised. The indicator isolates potential turning points on a price chart. It then draws arrows to indicate the existence of a pattern.
https://www.investopedia.com/terms/f/fractal.asp
- Parameters:
period (int) – Default is 2. Count of neighbour candles to match max or min tags.
inplace (bool) – Make it permanent in the instance or not.
overlap_plot (bool) – If True, it will overlap the indicator plot with the price plot.
suffix (str) – A decorative suffix for the name of the column created.
colors (list) – A list of colors for the indicator dataframe columns. Is the color to show when charts. It can be any color from plotly library or a number in the list of those. Default colors defined. https://community.plotly.com/t/plotly-colours-list/11730
- Return pd.Series:
A serie with 1 or -1 for local max or local min to tag.
- get_maker_taker_buy_ratios(window: int = 14, inplace=True, colors: list = None, suffix: str = '', nans_to_zeros=True) DataFrame
Generates the makers versus makers+takers volume ratio by each_kline. Also adds a moving average of the ratio.
- Parameters:
window (int) – The window of the moving average.
inplace (bool) – Permanent or not. Default is false, because of some testing required sometimes.
suffix (str) – A string to decorate resulting Pandas series name.
colors (str or int) – A colors list. Default is [“orange”, “skyblue”].
nans_to_zeros (bool) – If True, NaNs are converted to zeros.
- Returns:
A pandas series with the ratio and the moving average.
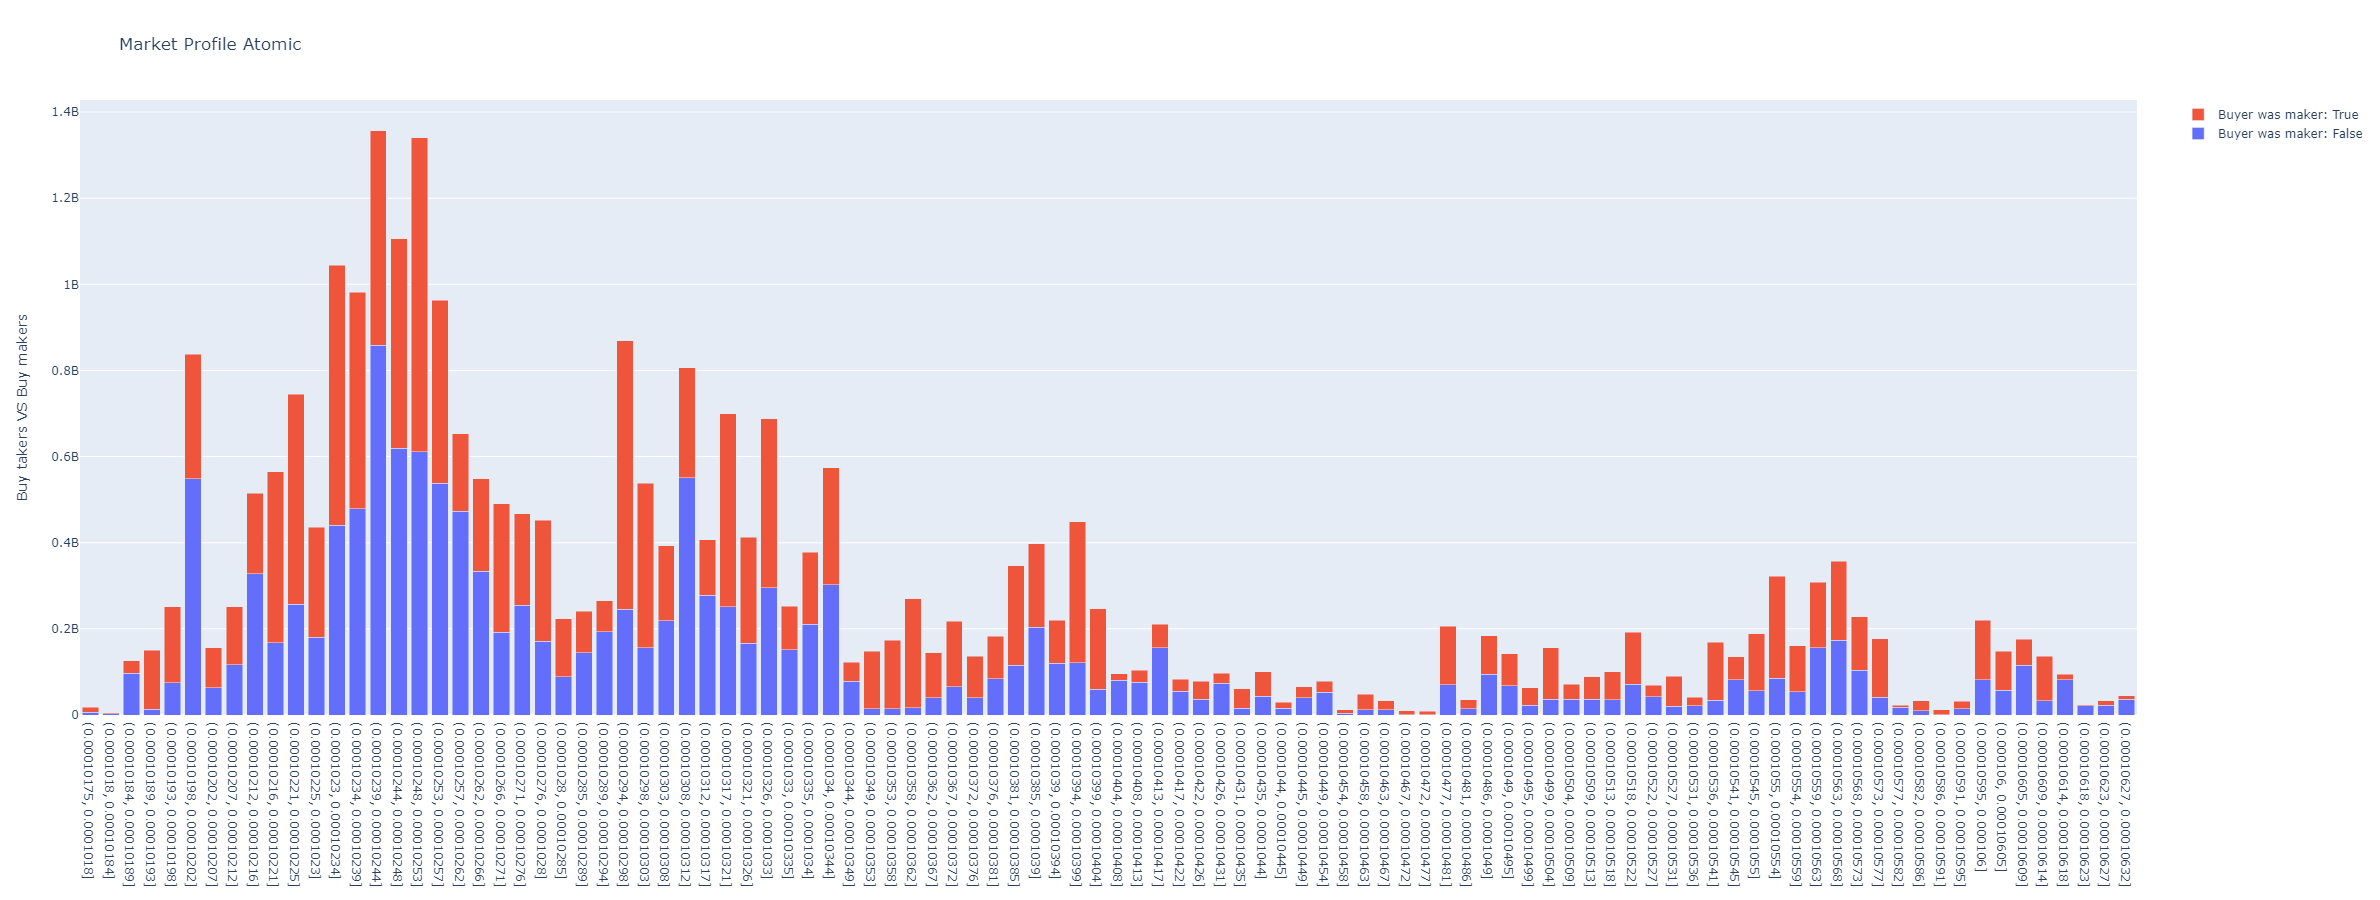
- get_market_profile(bins: int = 100, hours: int = None, minutes: int = None, startTime: int | str = None, endTime: int | str = None, from_agg_trades=False, from_atomic_trades=False, time_zone: str = None) DataFrame | None
Generates a market profile dataframe from trade or kline data. The market profile is a histogram of trading volumes at different price levels.
- Parameters:
bins – The number of price levels (bins) to include in the market profile.
hours – If specified, only the last ‘hours’ hours of data are used to generate the market profile.
minutes – If specified, only the last ‘minutes’ minutes of data are used to generate the market profile.
startTime – If specified, only data after this timestamp or date (in format %Y-%m-%d %H:%M:%S) are used.
endTime – If specified, only data before this timestamp or date (in format %Y-%m-%d %H:%M:%S) are used.
from_agg_trades – If True, aggregated trades data are used to generate the market profile.
from_atomic_trades – If True, atomic trades data are used to generate the market profile.
time_zone – The time zone to use for time index conversion (e.g., “Europe/Madrid”).
- Returns:
A DataFrame representing the market profile, or None if no suitable data are available.
- get_strategy_columns() list
Returns column names starting with “Strategy”.
- Return dict:
Updated strategy groups of columns.
- get_taker_maker_ratio_profile(bins: int = 100, hours: int = None, minutes: int = None, startTime: int | str = None, endTime: int | str = None, from_agg_trades=False, from_atomic_trades=False, time_zone: str = None) DataFrame | None
Generates a market profile of the makers versus makers+takers volume ratio by each_kline.
- Parameters:
bins – The number of price levels (bins) to include in the market profile.
hours – If specified, only the last ‘hours’ hours of data are used to generate the market profile.
minutes – If specified, only the last ‘minutes’ minutes of data are used to generate the market profile.
startTime – If specified, only data after this timestamp or date (in format %Y-%m-%d %H:%M:%S) are used.
endTime – If specified, only data before this timestamp or date (in format %Y-%m-%d %H:%M:%S) are used.
from_agg_trades – If True, aggregated trades data are used to generate the market profile.
from_atomic_trades – If True, atomic trades data are used to generate the market profile.
time_zone – The time zone to use for time index conversion (e.g., “Europe/Madrid”).
- Returns:
A DataFrame representing the market profile, or None if no suitable data are available.
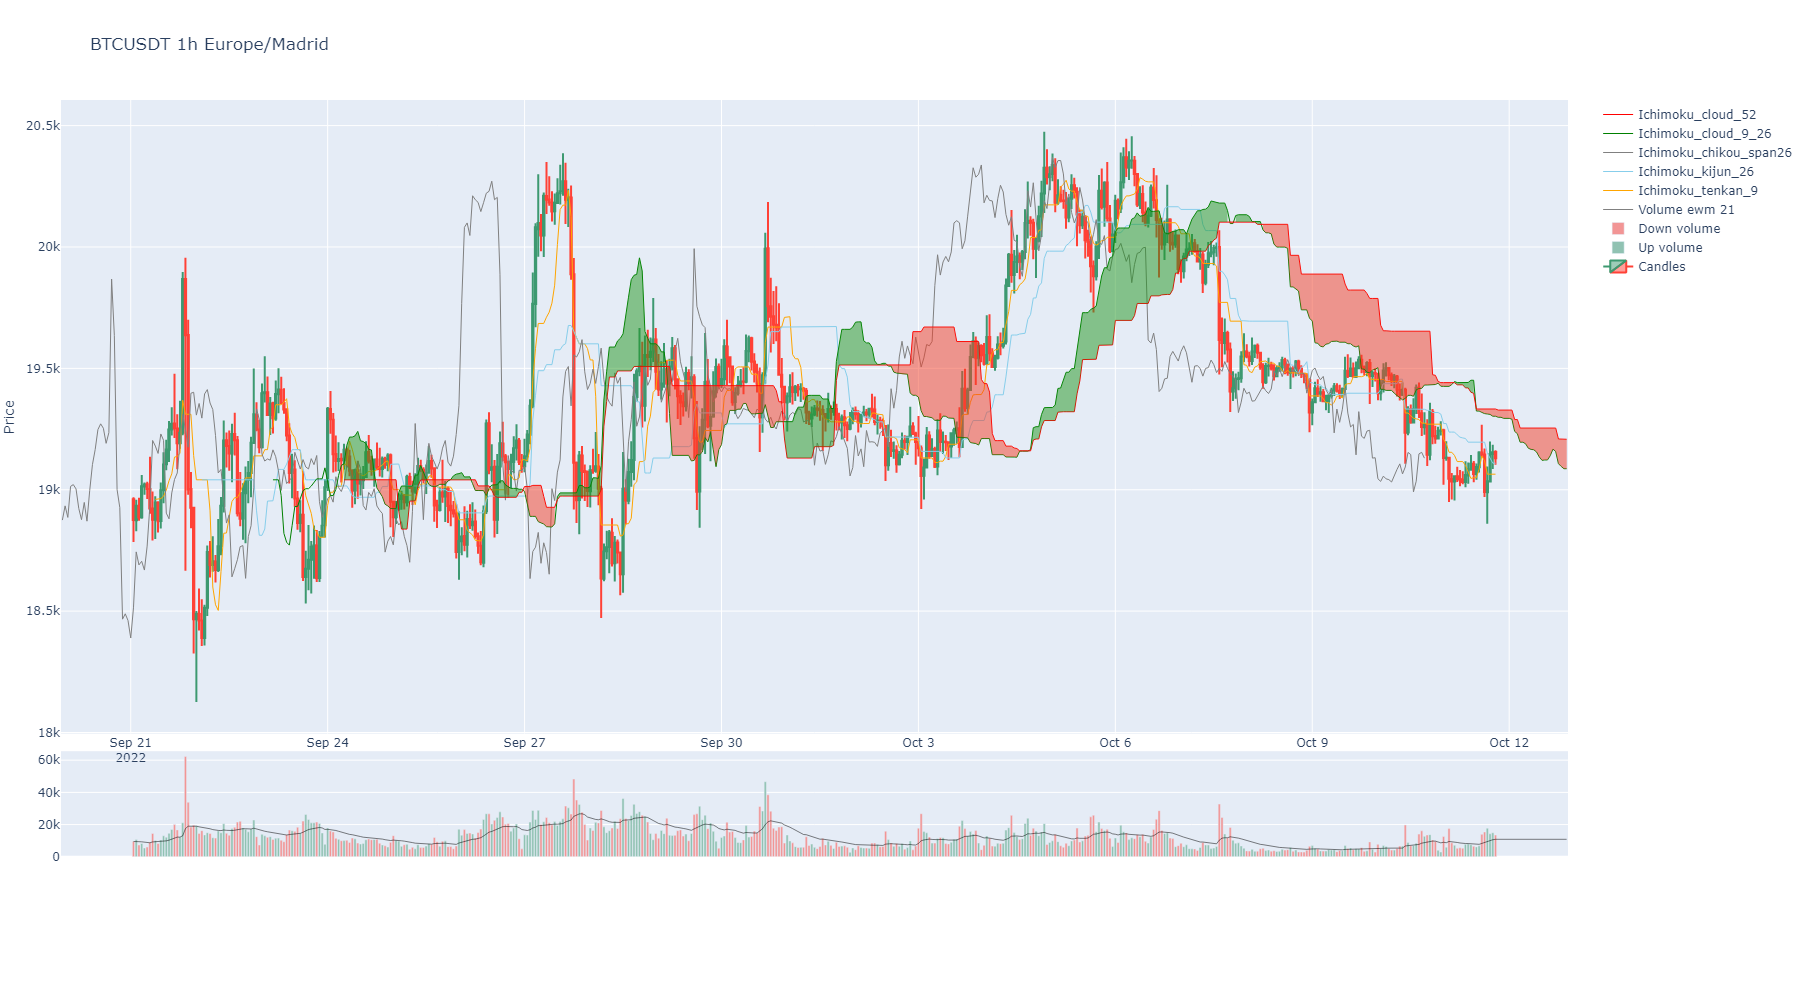
- ichimoku(tenkan: int = 9, kijun: int = 26, chikou_span: int = 26, senkou_cloud_base: int = 52, inplace: bool = True, suffix: str = '', colors: list = None) DataFrame
The Ichimoku Cloud is a collection of technical indicators that show support and resistance levels, as well as momentum and trend direction. It does this by taking multiple averages and plotting them on a chart. It also uses these figures to compute a “cloud” that attempts to forecast where the price may find support or resistance in the future.
- Parameters:
tenkan (int) – The short period. It’s the half sum of max and min price in the window. Default: 9
kijun (int) – The long period. It’s the half sum of max and min price in the window. Default: 26
chikou_span (int) – Close of the next 26 bars. Util for spotting what happened with other ichimoku lines and what happened before Default: 26.
senkou_cloud_base – Period to obtain kumo cloud base line. Default is 52.
inplace (bool) – Make it permanent in the instance or not.
suffix (str) – A decorative suffix for the name of the column created.
colors (list) – A list of colors for the indicator dataframe columns. Is the color to show when charts. It can be any color from plotly library or a number in the list of those. Default colors defined. https://community.plotly.com/t/plotly-colours-list/11730
- Returns:
pd.Series
- ma(ma_name: str = 'ema', column_source: str = 'Close', inplace: bool = False, suffix: str = None, color: str | int = None, **kwargs) Series
Generic moving average method. Calls pandas_ta ‘ma’ method.
https://github.com/twopirllc/pandas-ta/blob/main/pandas_ta/overlap/ma.py
- Parameters:
ma_name (str) – A moving average supported by the generic pandas_ta “ma” function.
column_source (str) – Name of column with data to be used.
inplace (bool) – Permanent or not. Default is false, because of some testing required sometimes.
suffix (str) – A string to decorate resulting Pandas series name.
color (str or int) – A color from plotly list of colors or its index in that list.
kwargs – From https://github.com/twopirllc/pandas-ta/blob/main/pandas_ta/overlap/ma.py
- Returns:
pd.Series
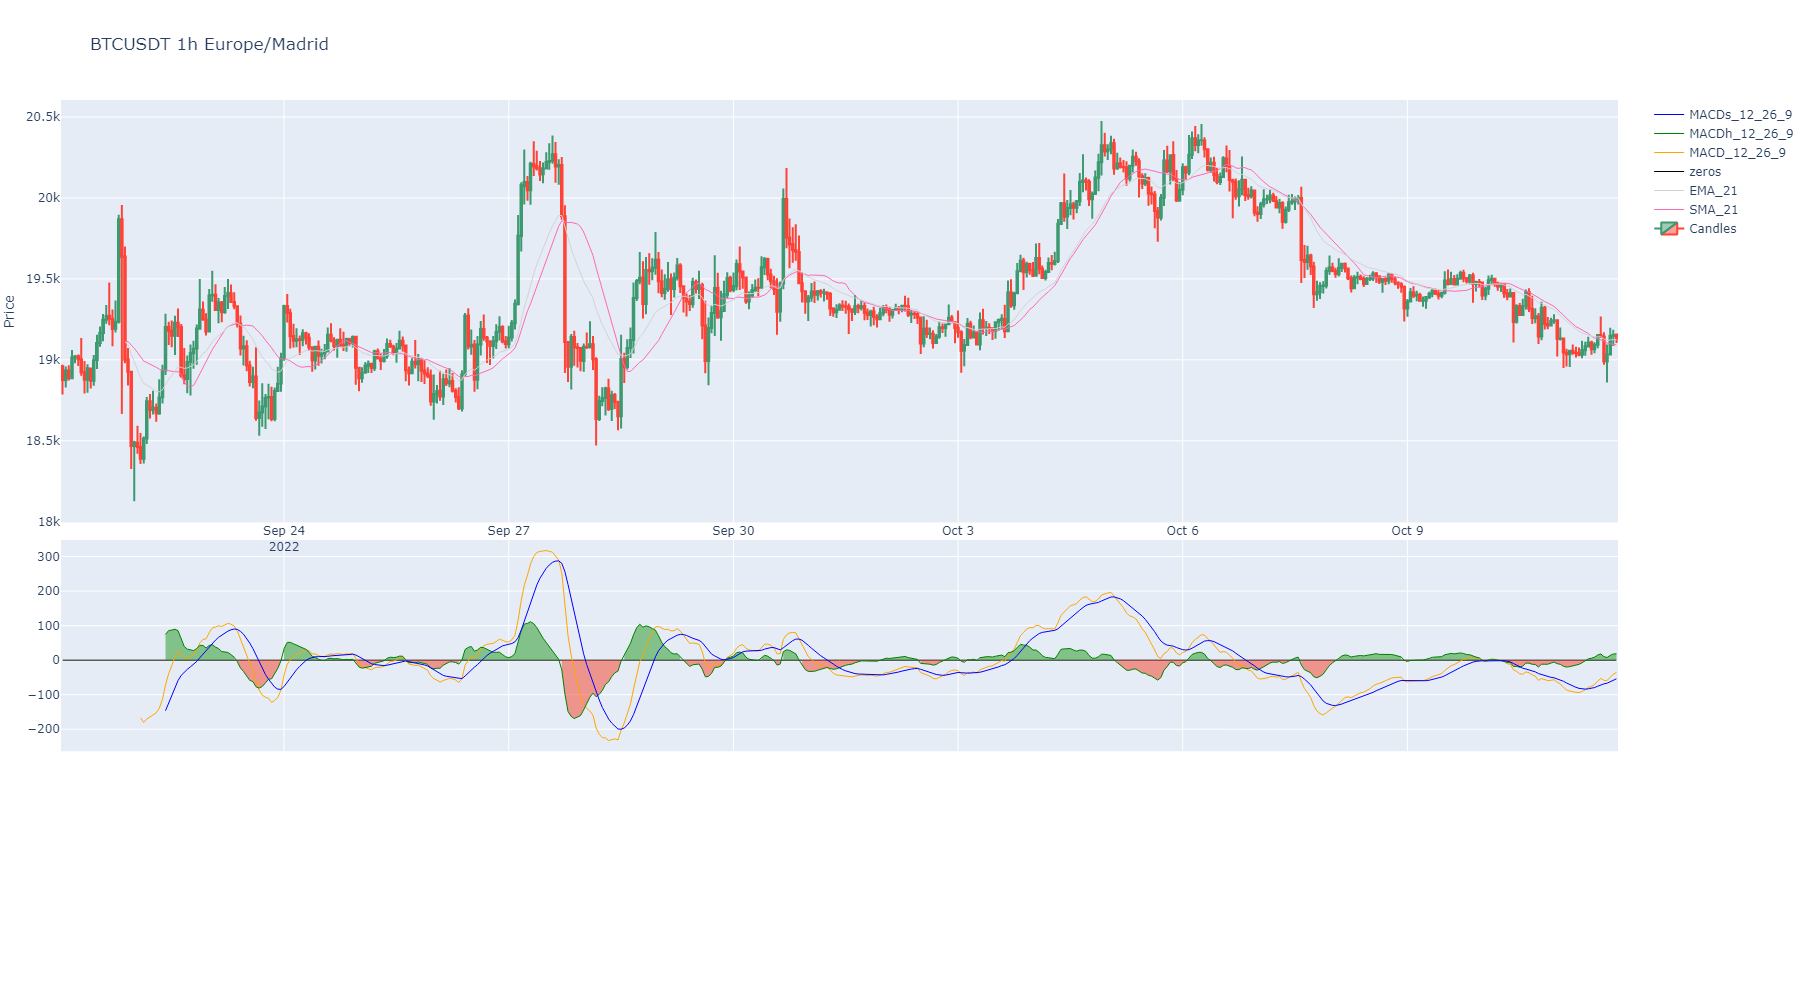
- macd(fast: int = 12, slow: int = 26, smooth: int = 9, inplace: bool = True, suffix: str = '', colors: list = None, **kwargs) DataFrame
Generate technical indicator Moving Average, Convergence/Divergence (MACD).
- Parameters:
fast (int) – Fast rolling window including the current candles when calculating the indicator.
slow (int) – Slow rolling window including the current candles when calculating the indicator.
smooth (int) – Factor to apply a smooth in values. A smooth is a kind of moving average in short period like 3 or 9.
inplace (bool) – Make it permanent in the instance or not.
suffix (str) – A decorative suffix for the name of the column created.
colors (list) –
A list of colors for the MACD dataframe columns. Is the color to show when charts. It can be any color from plotly library or a number in the list of those. Default colors defined.
kwargs – Optional from https://github.com/twopirllc/pandas-ta/blob/main/pandas_ta/momentum/macd.py
- Returns:
pd.Series
- merge_columns(main_column: str | int | Series, other_column: str | int | Series, sign_other: dict = None, strategy_group: str = '', inplace=True, suffix: str = '', color: str | int = 'grey') Series
Predominant serie will be filled nans with values, if existing, from the other serie.
Same kind of index needed.
- Parameters:
main_column (pd.Series) – A serie with nans to fill from other serie.
other_column (pd.Series) – A serie to pick values for the nans.
sign_other (dict) – Replace values by a dict for the “other column”. Default is: {1: -1}
strategy_group (str) – A name for a group of columns to assign to a strategy.
inplace (bool) – Permanent or not. Default is false, because of some testing required sometimes.
suffix (str) – A string to decorate resulting Pandas series name.
color (str | int) – A color from plotly list of colors or its index in that list.
- Return pd.Series:
A merged serie.
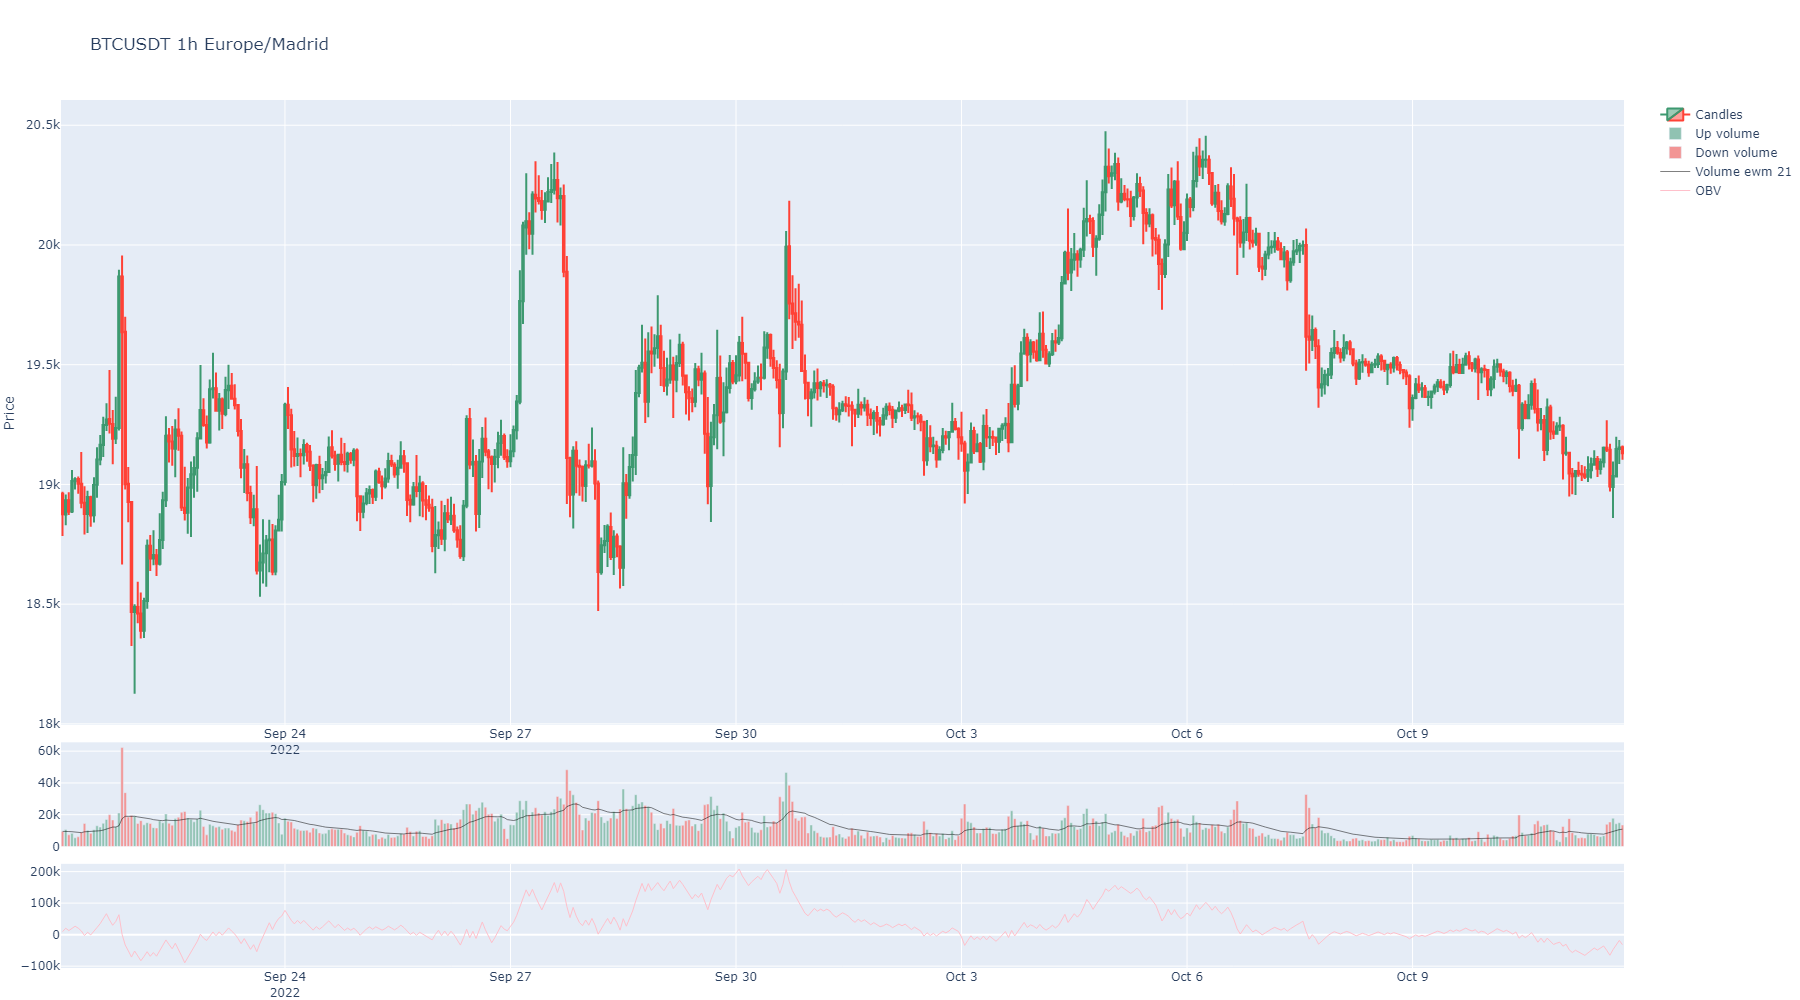
- on_balance_volume(inplace: bool = True, suffix: str = '', color: str | int = None, **kwargs) Series
On balance indicator.
- Parameters:
inplace (bool) – Make it permanent in the instance or not.
suffix (str) – A decorative suffix for the name of the column created.
kwargs – Optional from https://github.com/twopirllc/pandas-ta/blob/main/pandas_ta/volume/obv.py
- Returns:
A Pandas Series
- static pandas_ta_indicator(name: str, **kwargs) None
Calls any indicator in pandas_ta library with function name as first argument and any kwargs the function will use.
Generic calls are not added to object, just returned.
More info: https://github.com/twopirllc/pandas-ta
- Parameters:
name (str) – A function name. In example: ‘massi’ for Mass Index or ‘rsi’ for RSI indicator.
kwargs – Arguments for the requested indicator. Review pandas_ta info: https://github.com/twopirllc/pandas-ta#features
- Returns:
Whatever returns pandas_ta
Example:
sym = binpan.Symbol(symbol='LUNCBUSD', tick_interval='1m')

sym.pandas_ta_indicator(name='ichimoku', **{
                                          'high': sym.df['High'],
                                          'low': sym.df['Low'],
                                          'close': sym.df['Close'],
                                          'tenkan': 9,
                                          'kijun ': 26,
                                          'senkou ': 52})


      (                              ISA_9    ISB_26     ITS_9    IKS_26    ICS_26
       LUNCBUSD 1m UTC
       2022-10-06 23:27:00+00:00       NaN       NaN       NaN       NaN  0.000285
       2022-10-06 23:28:00+00:00       NaN       NaN       NaN       NaN  0.000285
       2022-10-06 23:29:00+00:00       NaN       NaN       NaN       NaN  0.000285
       2022-10-06 23:30:00+00:00       NaN       NaN       NaN       NaN  0.000285
       2022-10-06 23:31:00+00:00       NaN       NaN       NaN       NaN  0.000285
       ...                             ...       ...       ...       ...       ...
       2022-10-07 16:01:00+00:00  0.000292  0.000293  0.000291  0.000291       NaN
       2022-10-07 16:02:00+00:00  0.000292  0.000293  0.000292  0.000291       NaN
       2022-10-07 16:03:00+00:00  0.000292  0.000293  0.000292  0.000291       NaN
       2022-10-07 16:04:00+00:00  0.000292  0.000293  0.000292  0.000291       NaN
       2022-10-07 16:05:00+00:00  0.000292  0.000293  0.000292  0.000291       NaN

       [999 rows x 5 columns],
                                     ISA_9    ISB_26
       2022-10-10 16:05:00+00:00  0.000292  0.000293
       2022-10-11 16:05:00+00:00  0.000292  0.000293
       2022-10-12 16:05:00+00:00  0.000292  0.000293
       2022-10-13 16:05:00+00:00  0.000292  0.000293
       2022-10-14 16:05:00+00:00  0.000292  0.000293
       ...                             ...       ...
       2022-11-08 16:05:00+00:00  0.000291  0.000292
       2022-11-09 16:05:00+00:00  0.000291  0.000292
       2022-11-10 16:05:00+00:00  0.000292  0.000292
       2022-11-11 16:05:00+00:00  0.000292  0.000292
       2022-11-14 16:05:00+00:00  0.000292  0.000292

       [26 rows x 2 columns])
- plot(width: int = 1800, height: int = 1000, candles_ta_height_ratio: float = 0.75, volume: bool = True, title: str = None, yaxis_title: str = 'Price', overlapped_indicators: list = None, priced_actions_col: str = 'Close', actions_col: str = None, marker_labels: dict = None, markers: list = None, marker_colors: list = None, priced_markers: list = None, background_color=None, zoom_start_idx=None, zoom_end_idx=None, support_lines: list = None, support_lines_color: str = 'darkblue', resistance_lines: list = None, resistance_lines_color: str = 'darkred', date: str = None, date_radio: int = 20, show: bool = True, image_path: str = None) str | None
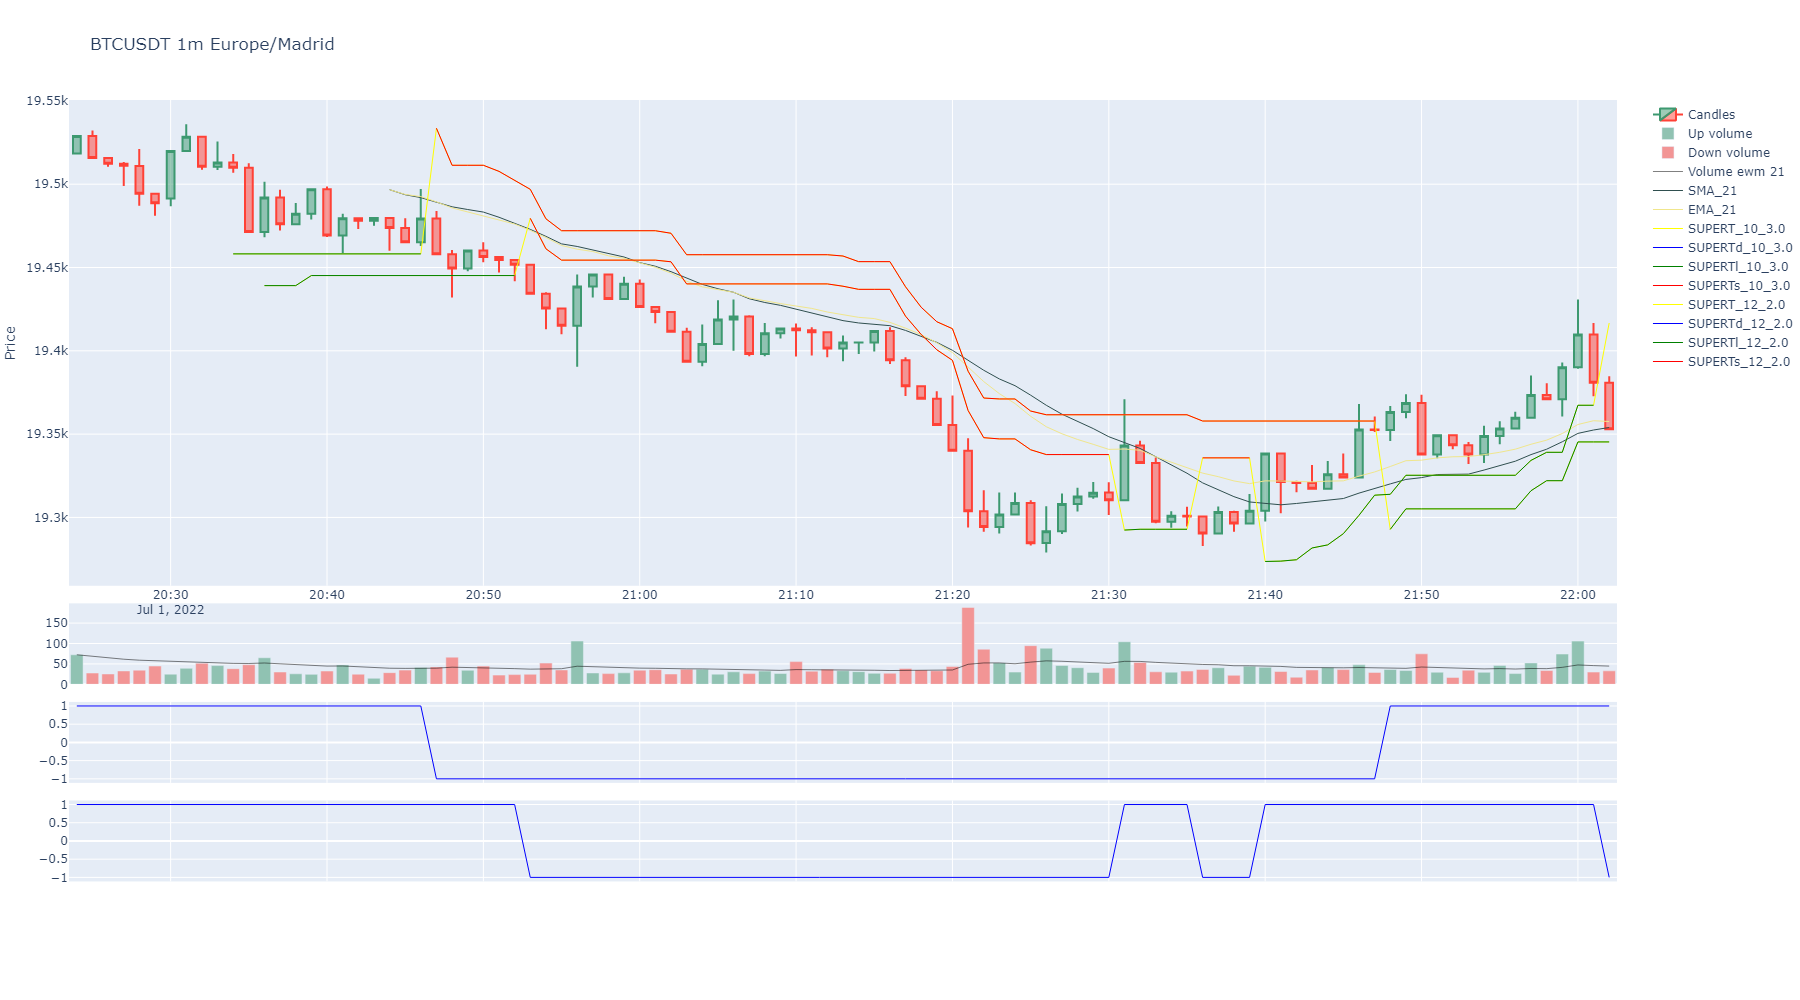
Plots a candles figure for the object.
Also plots any other technical indicator grabbed.
- Parameters:
width (int) – Width of the plot.
height (int) – Height of the plot.
candles_ta_height_ratio (float) – Proportion between candles and the other indicators. Not considering overlap ones in the candles plot.
volume (bool) – Plots volume.
title (str) – A tittle for the plot.
yaxis_title (str) – A title for the y axis.
overlapped_indicators (list) – Can declare as overlap in the candles plot some column.
priced_actions_col (str) – Priced actions to plot annotations over the candles, like buy, sell, etc. Under developing.
actions_col (str) – A column containing actions like buy or sell. Under developing.
marker_labels (dict) – Names for the annotations instead of the price. For ‘buy’ tags and ‘sell’ tags. Default is {‘buy’: 1, ‘sell’: -1}
markers (list) – Plotly marker type. Usually, if referenced by number will be a not filled mark and using string name will be a color filled one. Check plotly info: https://plotly.com/python/marker-style/
marker_colors (list) – Colors of the annotations.
priced_markers (list) – Explicit operation markers to overlay on exact points: a list of dicts
{'time', 'price', 'side', 'label'?}.side‘buy’ draws a green ▲ (label below), otherwise a red ▼ (label above).timeis a positional candle index (int) or a timestamp (snapped to the nearest candle);priceis the exact y level. Compatible with support/resistance lines and action columns (they overlay together).background_color (str) – Sets background color. Select a valid plotly color name.
zoom_start_idx (int) – It can zoom to an index interval.
zoom_end_idx (int) – It can zoom to an index interval.
support_lines (list) – A list of prices to plot horizontal lines in the candles plot for supports or any other level.
support_lines_color (str) – A color for horizontal lines, ‘darkblue’ is by default.
resistance_lines (list) – A list of prices to plot horizontal lines in the candles plot for resistances or any other level.
resistance_lines_color (str) – A color for horizontal lines, ‘darkred’ is by default.
date (str) – A date in string format to plot a zoom of a radio of klines up and down in time. Useful to inspect dates. Incompatible with zoom_start_idx and zoom_end_idx. Strings formatted as “2022-05-11 06:45:42”
date_radio (str) – A radio in klines to plot a zoom around a date.
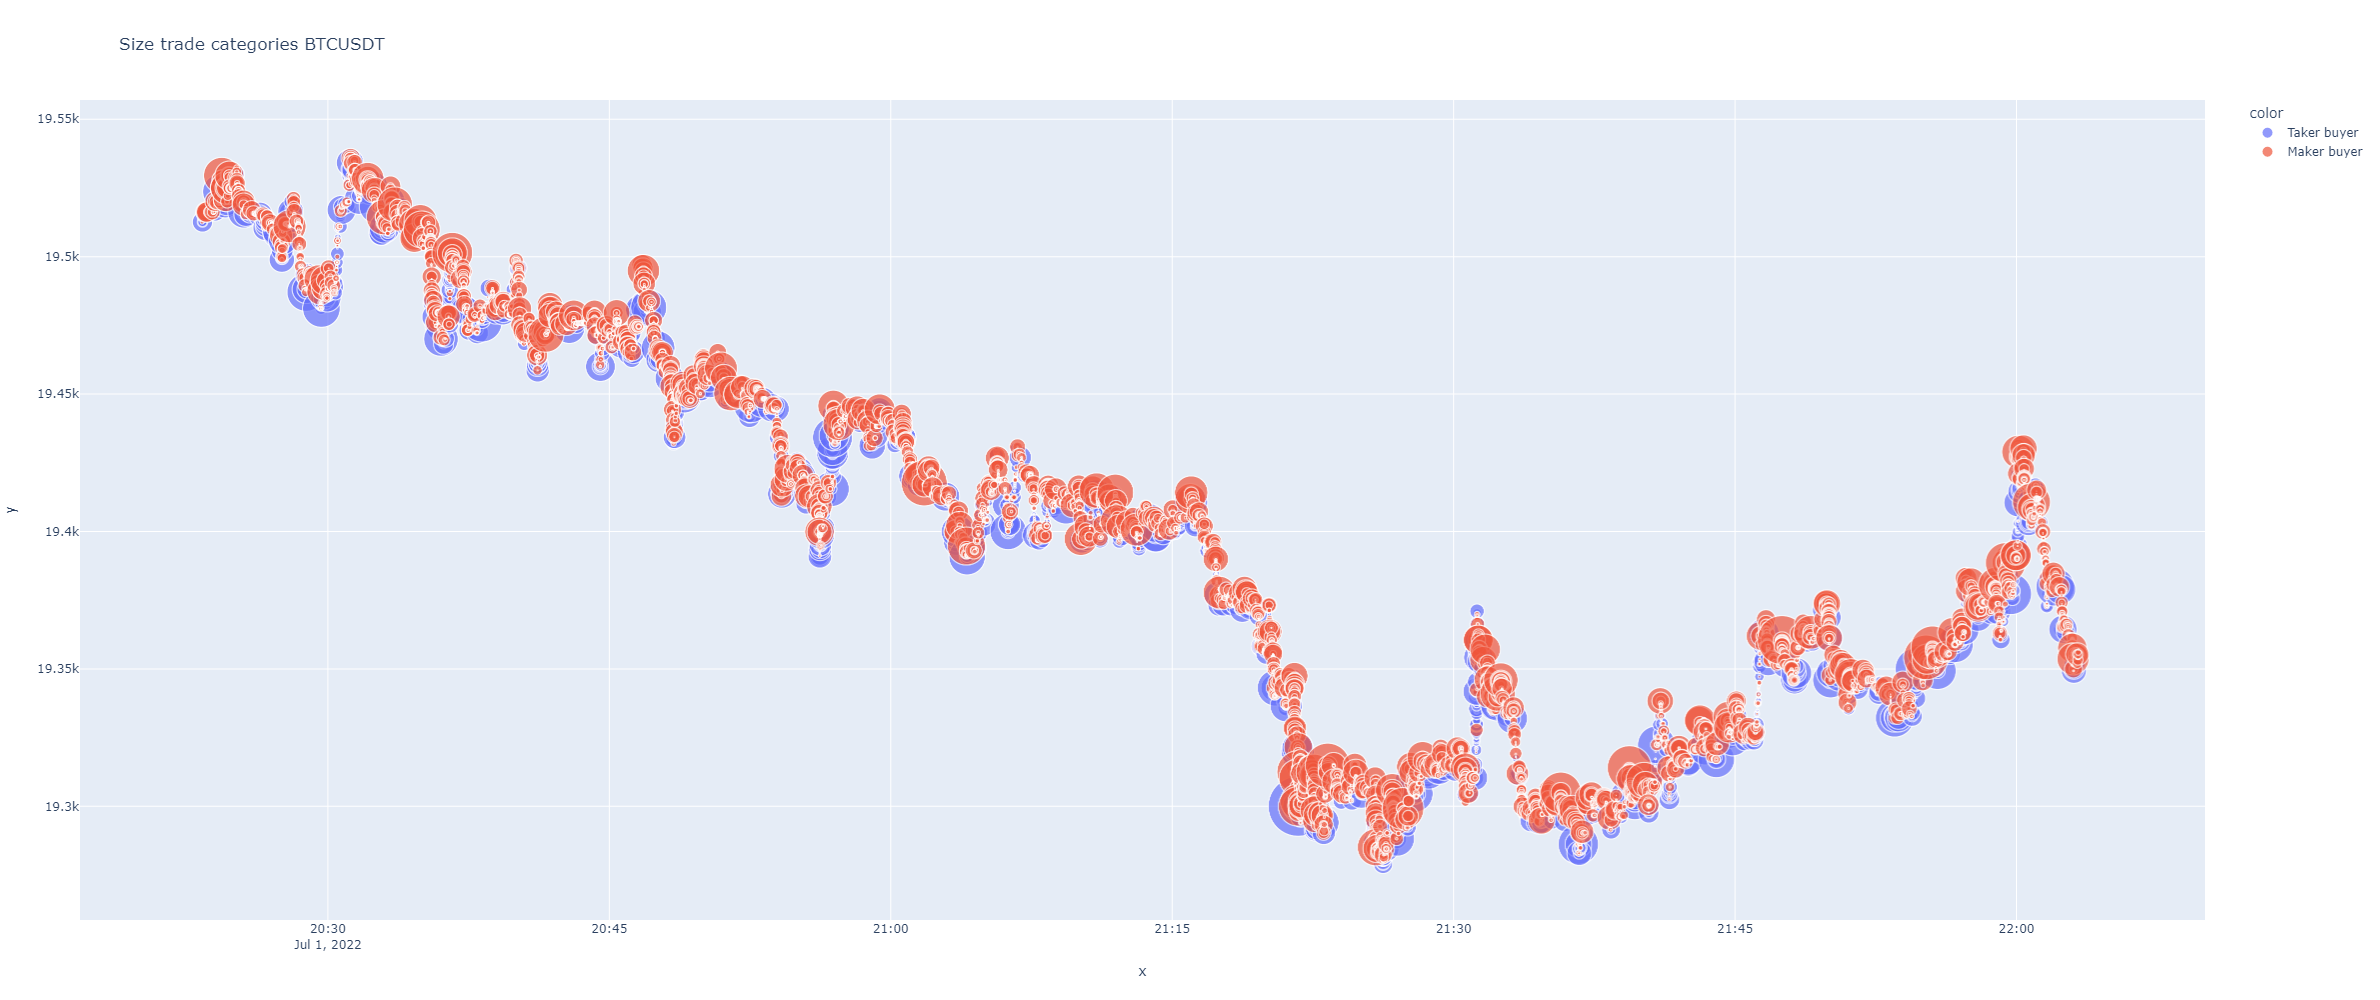
- plot_agg_trades_size(max_size: int = 60, height: int = 1000, logarithmic: bool = False, overlap_prices: bool = True, group_big_data: int = None, shifted: int = 1, title: str = None, size_column: str = 'Quantity', width: int = None, horizontal_lines: list = None, show: bool = True, image_path: str = None) str | None
It plots a time series graph plotting aggregated trades sized by quantity and color if taker or maker buyer.
- Parameters:
max_size (int) – Max size for the markers. Default is 60. Useful to show whales operating.
height (int) – Default is 1000.
logarithmic (bool) – If logarithmic, then “y” axis scale is shown in logarithmic scale.
group_big_data (int) – Deprecated, ignored. Kept for backward compatibility.
shifted (bool) – If True, shifts prices to plot klines one step to the right, that’s more natural to see trades action in price.
overlap_prices (bool) – If True, plots overlap line with High and Low prices.
title – Graph title.
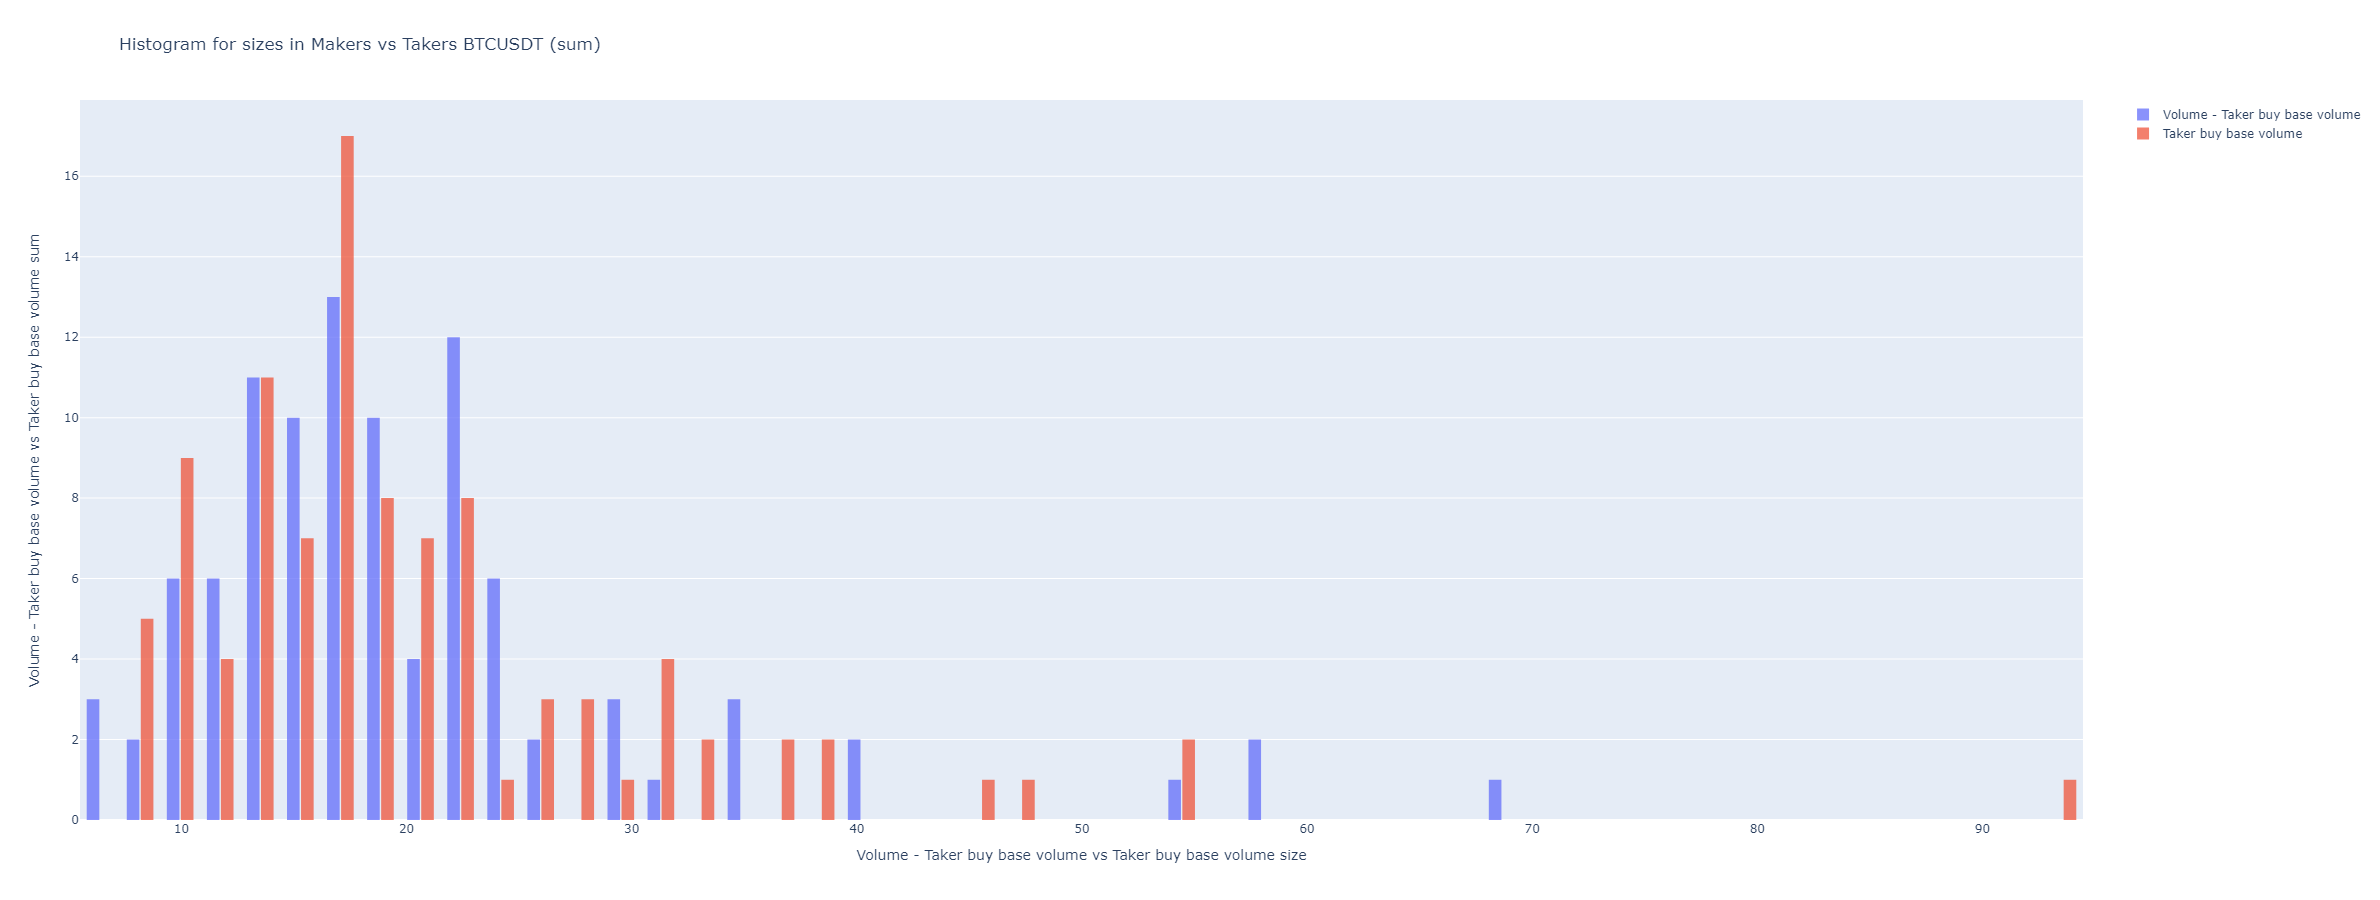
- plot_aggression_sizes(bins=50, hist_funct='sum', height=900, from_trades=False, title: str = None, total_volume_column: str = None, partial_vol_column: str = None, **kwargs_update_layout) str | None
Binance fees can be cheaper for maker orders, many times when big traders, like whales, are operating . Showing what are doing makers.
It shows which kind of volume or trades came from, aggressive_sellers or aggressive_byers.
Can be useful finding support and resistance zones.
- Parameters:
bins – How many bars.
hist_funct – The way graph data is showed. It can be ‘mean’, ‘sum’, ‘percent’, ‘probability’, ‘density’, or ‘probability density’
height – Height of the graph.
from_trades – Requieres grabbing trades before.
title – A title.
total_volume_column – The column with the total volume. It defaults automatically.
partial_vol_column – The column with the partial volume. It defaults automatically. API shows maker or taker separated volumes.
kwargs_update_layout – Optional
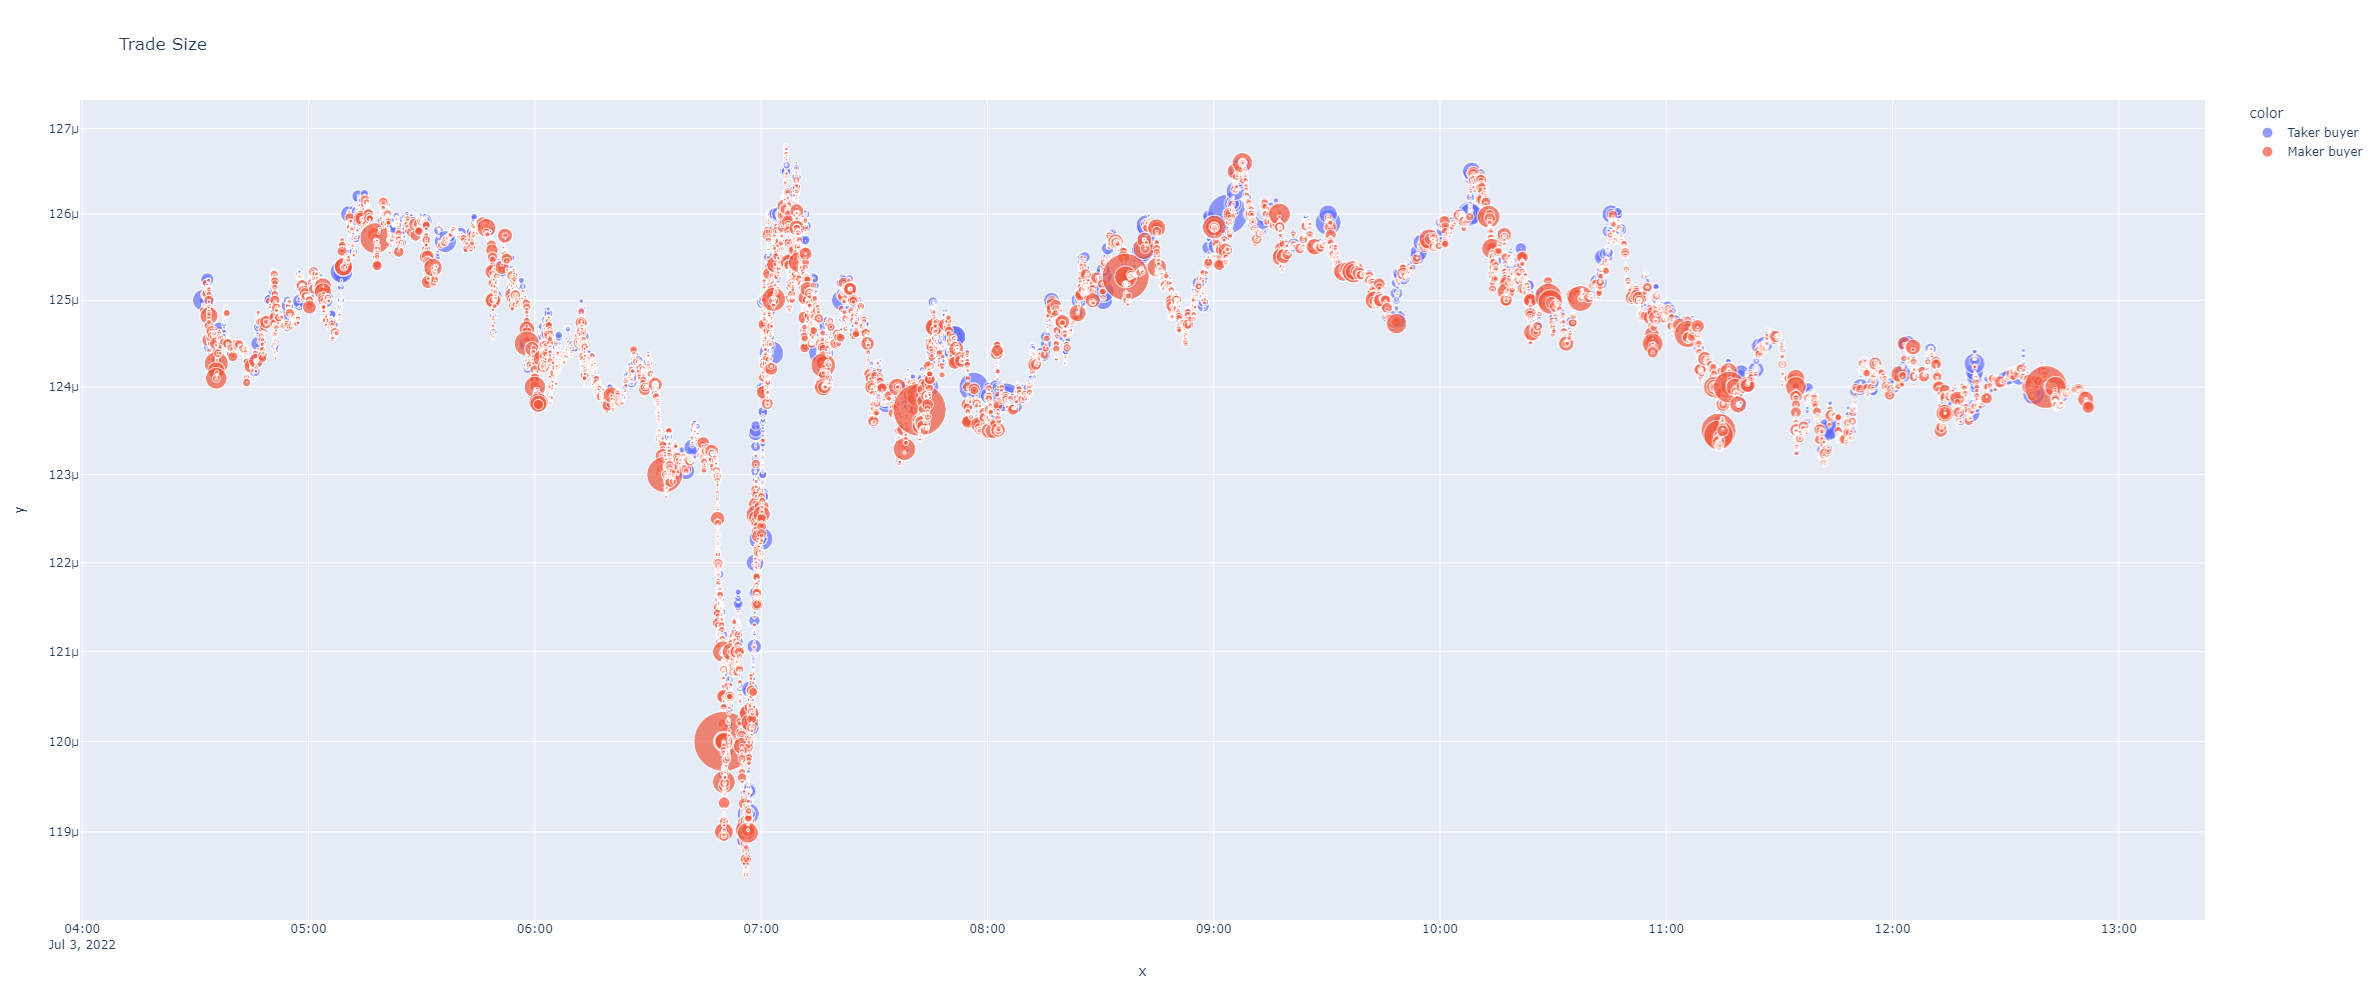
- plot_atomic_trades_size(max_size: int = 60, height: int = 1000, logarithmic: bool = False, overlap_prices: bool = True, group_big_data: int = None, shifted: int = 1, title: str = None, size_column: str = 'Quantity', width: int = None, horizontal_lines: list = None, show: bool = True, image_path: str = None) str | None
It plots a time series graph plotting atomic trades sized by quantity and color if taker or maker buyer.
- Parameters:
max_size (int) – Max size for the markers. Default is 60. Useful to show whales operating.
height (int) – Default is 1000.
logarithmic (bool) – If logarithmic, then “y” axis scale is shown in logarithmic scale.
group_big_data (int) – Deprecated, ignored. Kept for backward compatibility.
shifted (bool) – If True, shifts prices to plot klines one step to the right, that’s more natural to see trades action in price.
overlap_prices (bool) – If True, plots overlap line with High and Low prices.
title – Graph title.
- plot_market_profile(bins: int = 100, hours: int = None, minutes: int = None, startTime: int | str = None, endTime: int | str = None, height=900, from_agg_trades=False, from_atomic_trades=False, title: str = None, time_zone: str = None, **kwargs_update_layout) str | None
Plots volume histogram by prices segregated aggressive buyers from sellers.
- Parameters:
bins (int) – How many bars.
hours (int) – If passed, it use just last passed hours for the plot.
minutes (int) – If passed, it use just last passed minutes for the plot.
startTime (int | str) – If passed, it use just from the timestamp or date in format (%Y-%m-%d %H:%M:%S: 2022-05-11 06:45:42)) for the plot.
endTime (int | str) – If passed, it use just until the timestamp or date in format (%Y-%m-%d %H:%M:%S: 2022-05-11 06:45:42)) for the plot.
height – Height of the graph.
from_agg_trades – Requieres grabbing aggregated trades before.
from_atomic_trades – Requieres grabbing atomic trades before.
title – A title.
time_zone (str) – A time zone for time index conversion. Example: “Europe/Madrid”
kwargs_update_layout – Optional
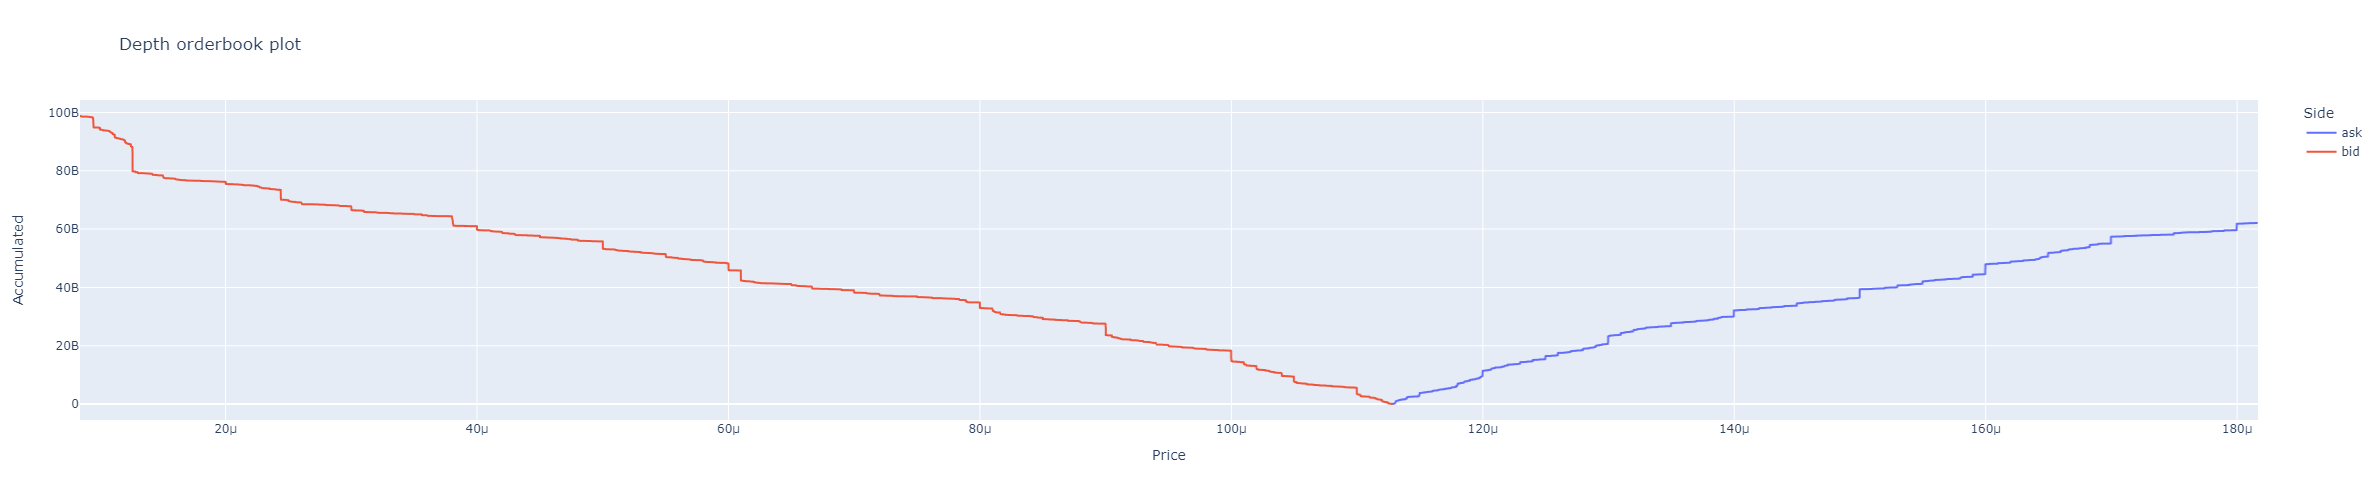
- plot_orderbook(accumulated=True, title='Depth orderbook plot', height=800, plot_y='Quantity', **kwargs) str | None
Plots orderbook depth.
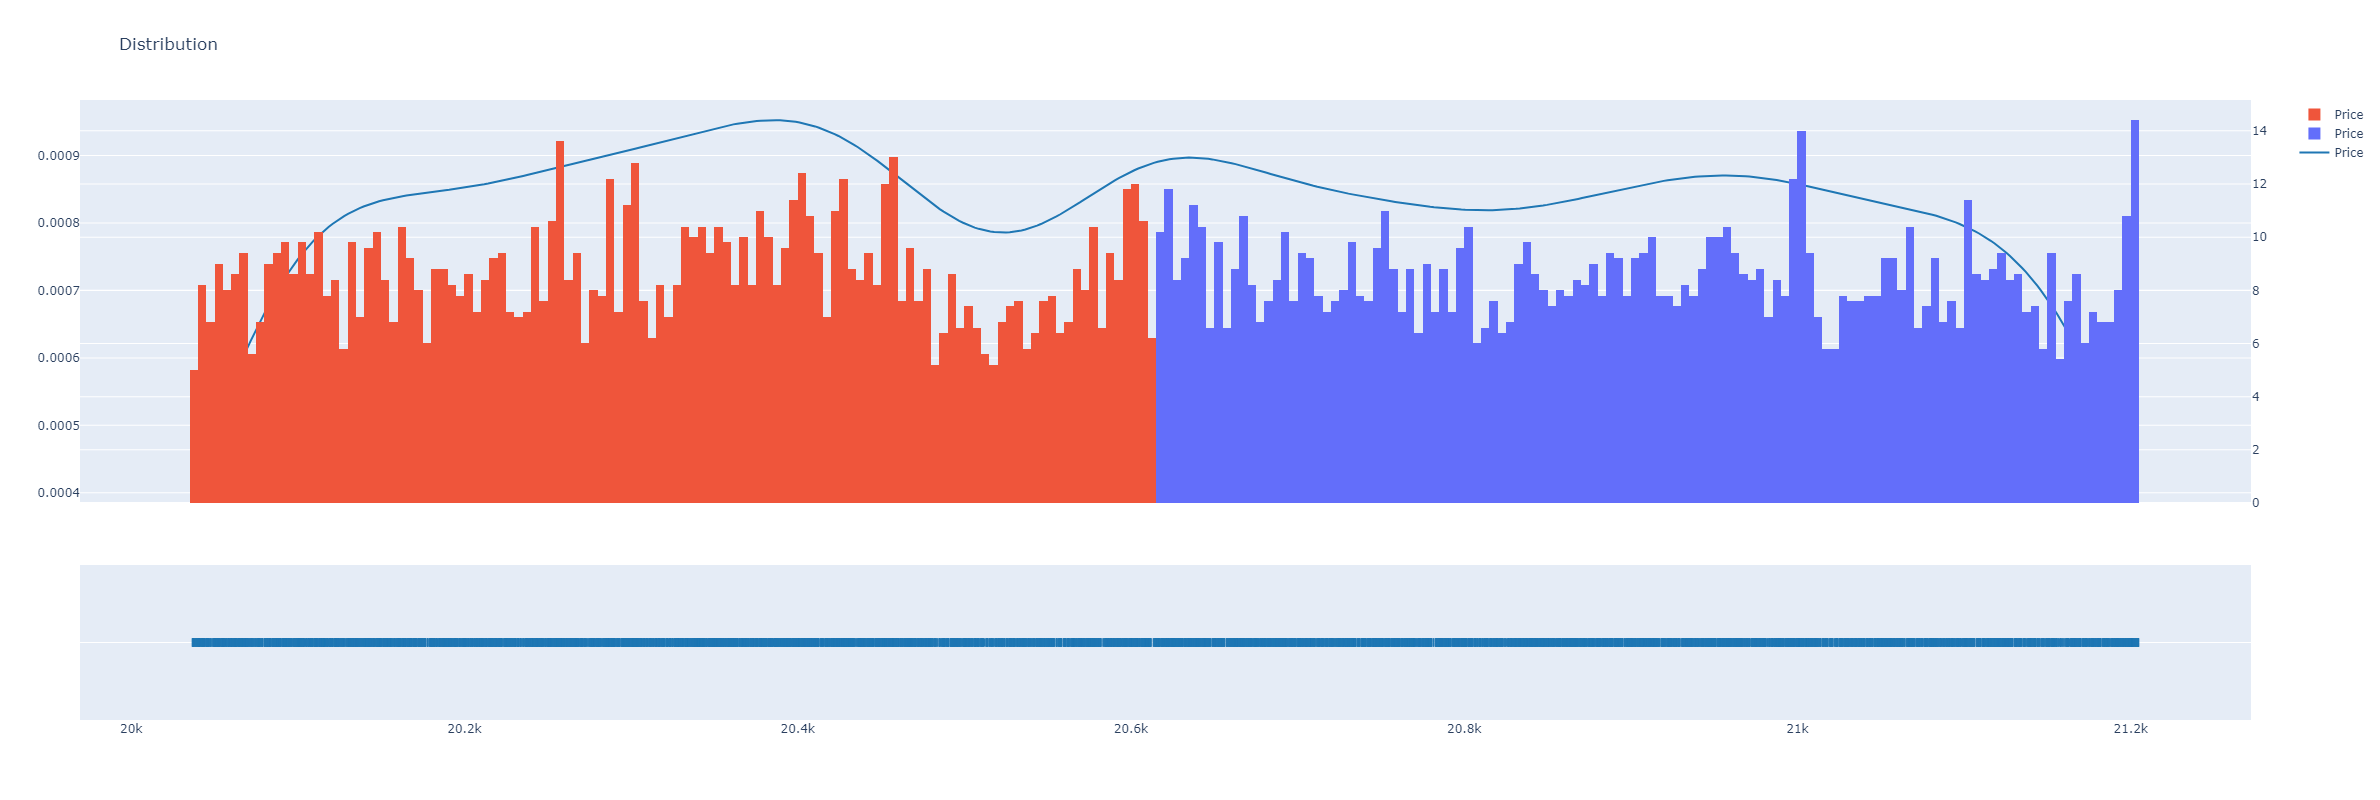
- plot_orderbook_density(x_col='Price', color='Side', bins=300, histnorm: str = 'density', height: int = 800, title: str = None, **update_layout_kwargs) str | None
Plot a distribution plot for a dataframe column. Plots line for kernel distribution.
- Parameters:
x_col (str) – Column name for x-axis data.
color (str) – Column name with tags or any values for using as color scale.
bins (int) – Columns in histogram.
histnorm (str) – One of ‘percent’, ‘probability’, ‘density’, or ‘probability density’ from plotly express documentation. https://plotly.github.io/plotly.py-docs/generated/plotly.express.histogram.html
height (int) – Plot sizing.
title (str) – A title string
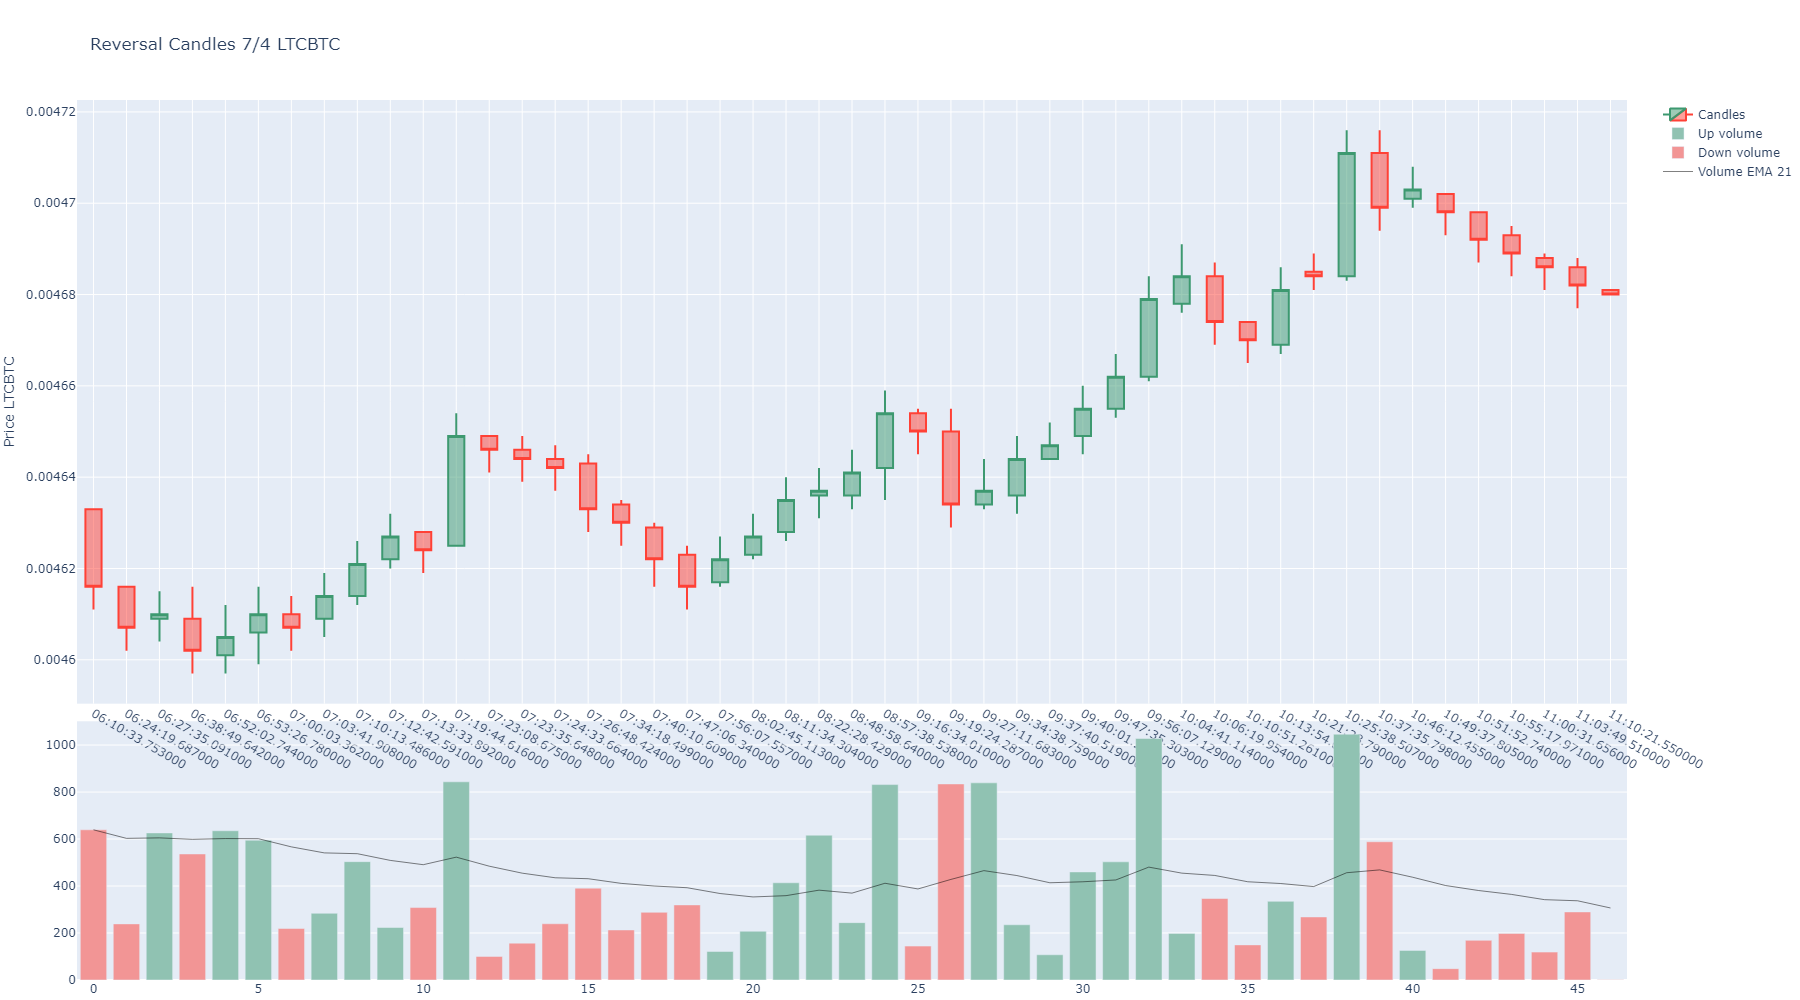
- plot_reversal(min_height: int = None, min_reversal: int = None, text_index: bool = True, from_atomic: bool = False, **kwargs) str | None
Plots reversal candles. It requires aggregated or atomic trades fetched previously.
BinPan manages aggregated trades from binance API.
- Parameters:
- Returns:
Example:
import binpan

 ltc = binpan.Symbol(symbol='ltcbtc',
                     tick_interval='5m',
                     time_zone = 'Europe/Madrid',
                     time_index = True,
                     closed = True,
                     hours=5)
ltc.get_trades()
ltc.get_reversal_candles()
ltc.plot_reversal()
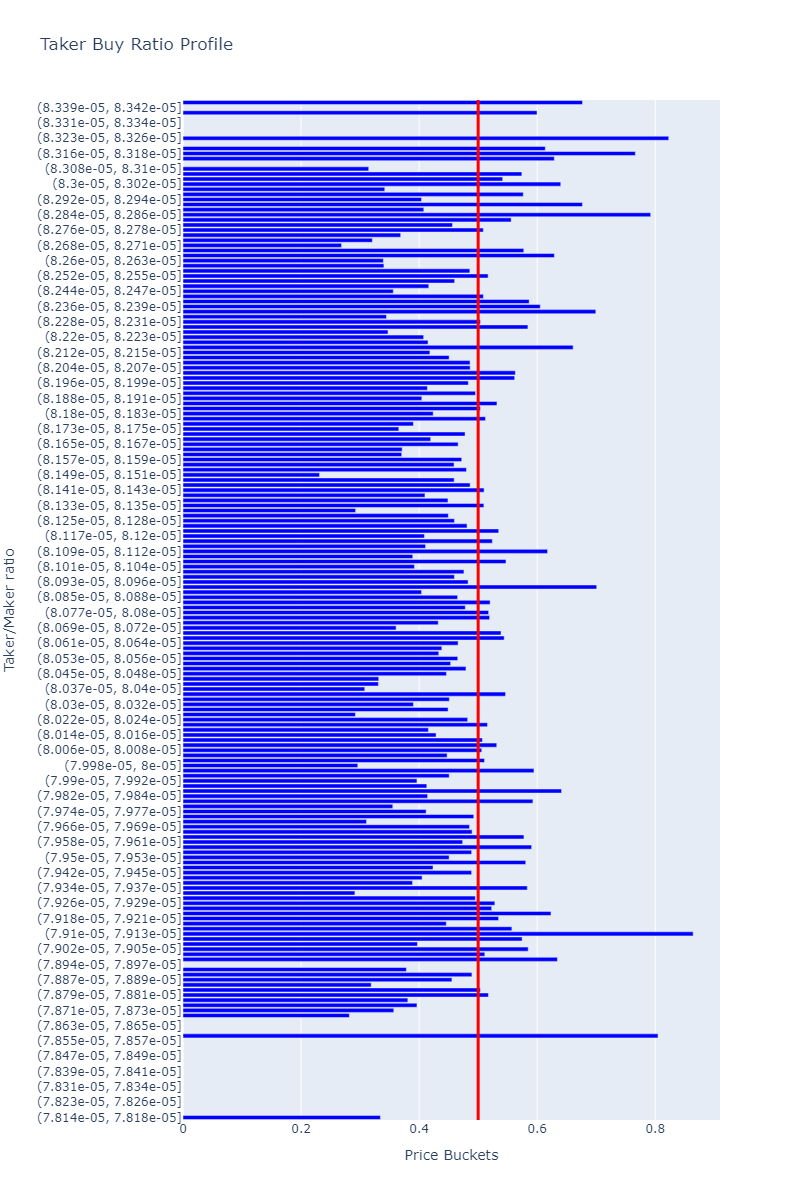
- plot_taker_maker_ratio_profile(bins: int = 100, hours: int = None, minutes: int = None, startTime: int | str = None, endTime: int | str = None, from_agg_trades=False, from_atomic_trades=False, time_zone: str = None, title: str = 'Taker Buy Ratio Profile', height=1200, width=800, **kwargs_update_layout) str
Plots taker vs maker ratio profile.
- Parameters:
bins (int) – How many bars.
hours (int) – If passed, it use just last passed hours for the plot.
minutes (int) – If passed, it use just last passed minutes for the plot.
startTime (int | str) – If passed, it use just from the timestamp or date in format (%Y-%m-%d %H:%M:%S: 2022-05-11 06:45:42)) for the plot.
endTime (int | str) – If passed, it use just until the timestamp or date in format (%Y-%m-%d %H:%M:%S: 2022-05-11 06:45:42)) for the plot.
height – Height of the graph.
width – Width of the graph.
from_agg_trades – Requieres grabbing aggregated trades before.
from_atomic_trades – Requieres grabbing atomic trades before.
title – A title.
time_zone (str) – A time zone for time index conversion. Example: “Europe/Madrid”
kwargs_update_layout – Optional
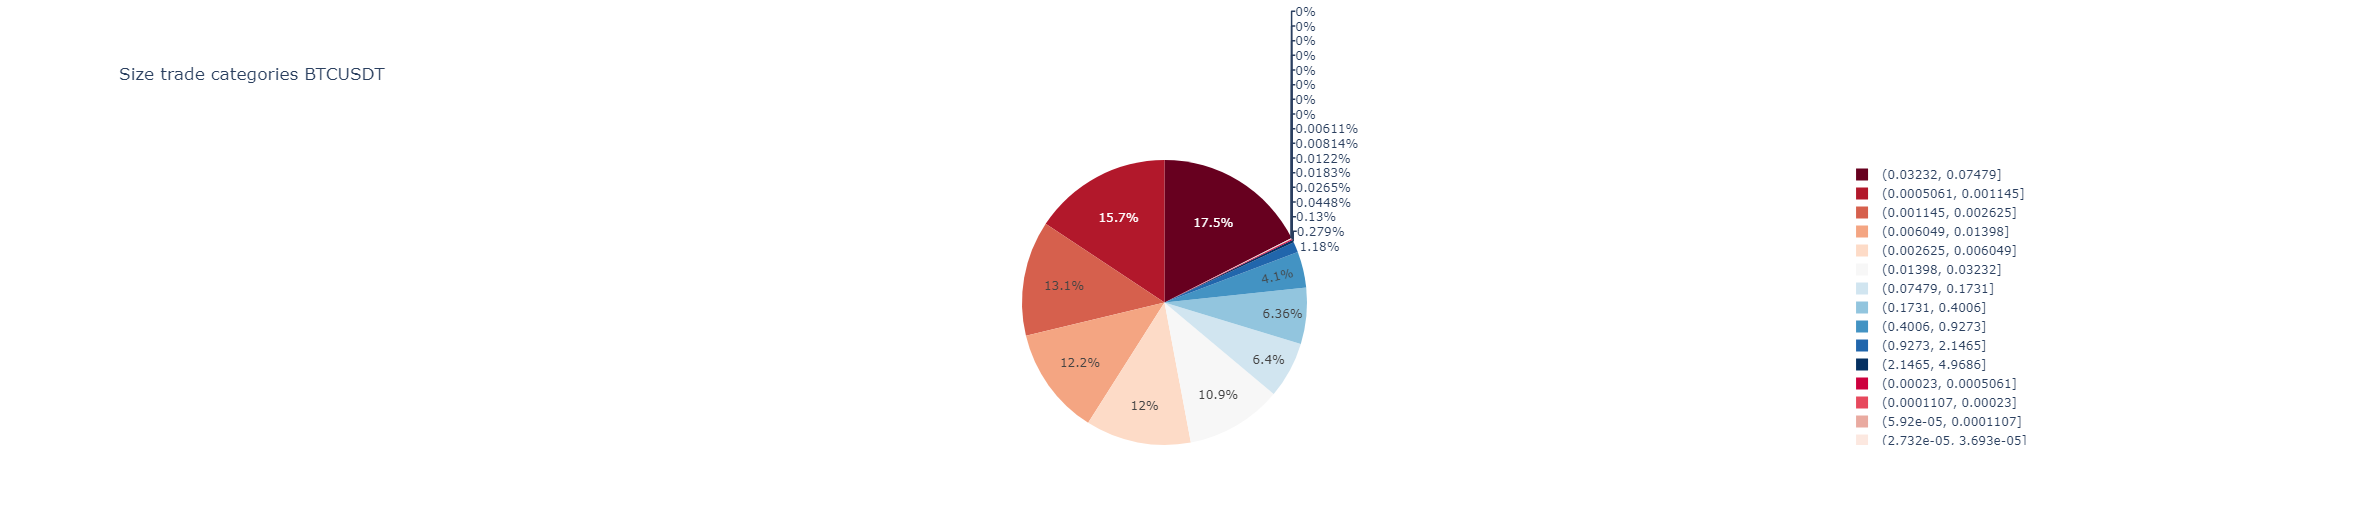
- plot_trades_pie(categories: int = 25, logarithmic=True, title: str = None) str | None
Plots a pie chart. Useful profiling size of trades. Size can be distributed in a logarithmic scale.
- Parameters:
categories – How many groups of sizes.
logarithmic – Logarithmic scale to show more small sizes.
title – A title for the plot.
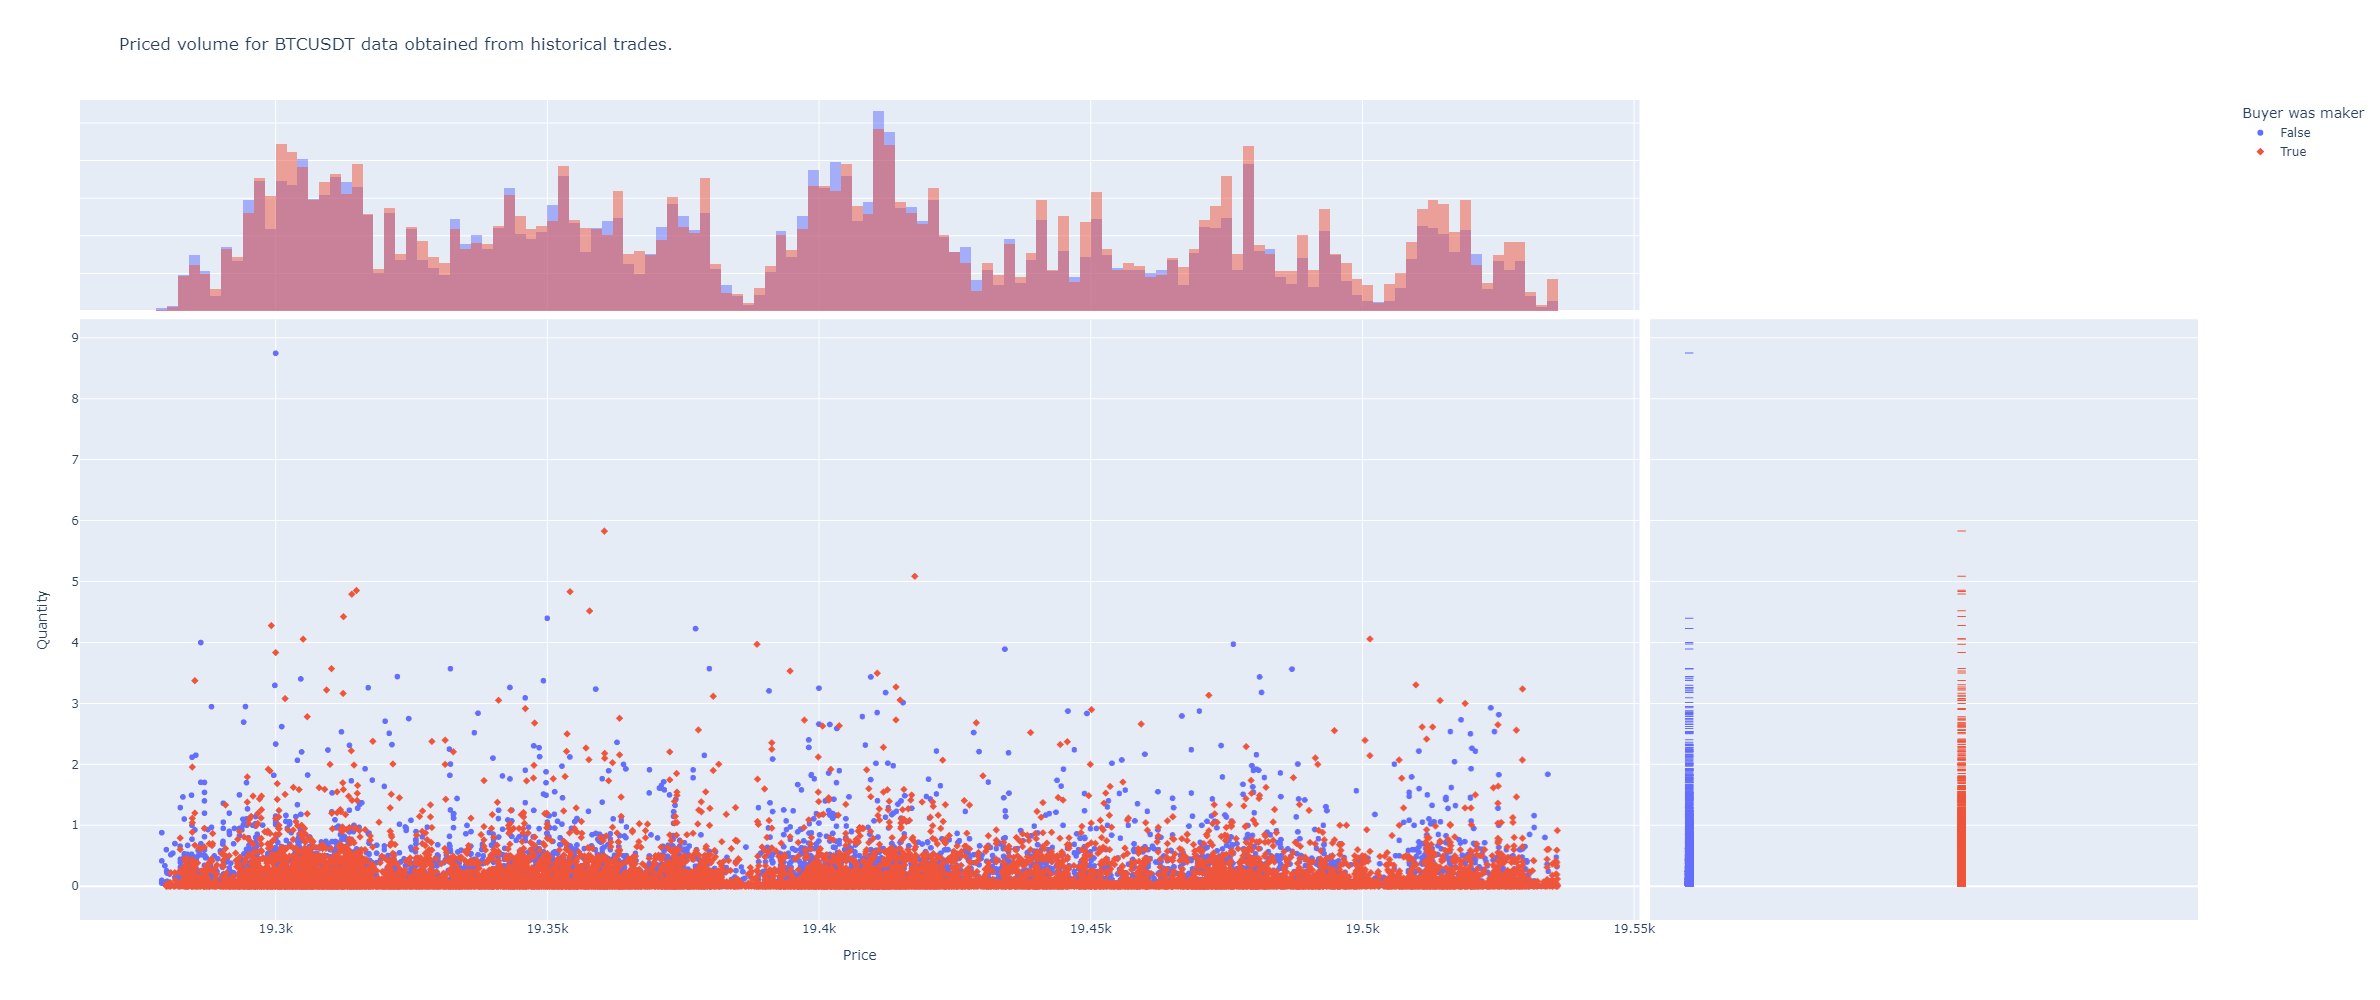
- plot_trades_scatter(x: str = None, y: str = None, dot_symbol='Buyer was maker', color: str = None, marginal=True, from_trades=True, height=1000, color_referenced_to_y=True, **kwargs) str | None
A scatter plot showing each price level volume or trades.
It can be useful finding support and resistance zones.
- Parameters:
dot_symbol – Column with discrete values to assign different symbols for the plot marks.
x – Name of the column with prices. From trades or candles.
y – Name of the column with sizes. From trades or candles.
color – Column with values to use in color scale.
marginal – Show or not lateral plots.
from_trades – Uses trades instead of candles. Useful to avoid grabbing very long time intervals. Result should be similar.
height – Height of the plot.
color_referenced_to_y – Scales color in y axis.
kwargs – Optional plotly args.
- plot_volume_profile(bins: int = 50, value_area_pct: float = 0.7, from_agg_trades: bool = False, from_atomic_trades: bool = False, hours: int = None, minutes: int = None, startTime: int | str = None, endTime: int | str = None, time_zone: str = None, title: str = None, height: int = 900, width: int = None, horizontal_lines: list = None, priced_markers: list = None, show: bool = True, image_path: str = None) str | None
Volume Profile (VPVR): velas + histograma horizontal de volumen, con POC y Value Area.
Dibuja las velas a la izquierda y, compartiendo el eje de precio, un histograma horizontal del volumen por nivel a la derecha. Resalta la Value Area, traza el POC y marca los LVN (huecos por donde el precio viaja rapido). Util para ver imanes y soportes/resistencias por aceptacion. Los numeros (POC/VAH/VAL/HVN/LVN) se obtienen con
volume_profile().- Parameters:
bins (int) – numero de niveles del histograma. Default 50.
value_area_pct (float) – fraccion del volumen dentro de la Value Area. Default 0.70.
from_agg_trades (bool) – perfil fino desde aggregated trades (requiere
get_agg_trades()antes).from_atomic_trades (bool) – perfil desde atomic trades (requiere
get_atomic_trades()antes).hours (int) – si se pasa, solo las ultimas ‘hours’ horas.
minutes (int) – si se pasa, solo los ultimos ‘minutes’ minutos.
startTime – timestamp/fecha de inicio (rango fijo).
endTime – timestamp/fecha de fin (rango fijo).
time_zone (str) – zona horaria para el indice temporal.
title (str) – titulo del grafico.
height (int) – alto px. Default 900.
width (int) – ancho px. Si None, autosize.
horizontal_lines (list) – precios extra (entrada/stop/TP) como lineas discontinuas.
priced_markers (list) – marcadores de operacion (▲ compra / ▼ venta) en puntos exactos sobre las velas: lista de
{'time', 'price', 'side', 'label'?}(verset_price_markers).show (bool) – si True (default) abre la figura interactiva; False para uso headless/servidor.
image_path (str) – ruta del PNG de salida. Por defecto
last_plot.pngen el cwd.
- Returns:
ruta absoluta de la imagen exportada, o None si falla.
- profit_hour(column: str = None) float
It returns win or loos quantity per hour. Just compares first and last value. Expected datetime index. If not column passed, it will search for an Evaluation column.
- Parameters:
column (str) – A column in the BinPan’s DataFrame with values to check profit with expected datetime index.
- Return float:
Resulting return of inversion.
- remove_plot_info_associated_columns(columns: list, row_level: str) list
Completely remove plot info for a column in main dataframe of klines.
- remove_plot_info_for_column(column: str) None
Remove plot info for a column in main dataframe of klines. :param column:
- roc(length: int = 1, escalar: int = 100, inplace: bool = True, suffix: str = '', color: str | int = None, **kwargs) Series
The Rate of Change (ROC) is a technical indicator that measures the percentage change between the most recent price and the price “n” day’s ago. The indicator fluctuates around the zero line.
- Parameters:
length (str) – The short period. Default: 1
escalar (str) – How much to magnify. Default: 100.
inplace (bool) – Make it permanent in the instance or not.
suffix (str) – A decorative suffix for the name of the column created.
color (str or int) – Is the color to show when plotting or index in that list.
kwargs – Optional from https://github.com/twopirllc/pandas-ta/blob/main/pandas_ta/momentum/roc.py
- Returns:
A Pandas Series
- roi(column: str = None) float
It returns win or loos percent for a evaluation column. Just compares first and last value increment by the first price in percent. If not column passed, it will search for an Evaluation column.
- Parameters:
column (str) – A column in the BinPan’s DataFrame with values to check ROI (return of inversion).
- Return float:
Resulting return of inversion.
- rolling_support_resistance(minutes_window: int = None, time_steps_minutes: int = None, discrete_interval: str = None, from_atomic: bool = False, from_aggregated: bool = False, max_clusters: int = 5, by_quantity: bool = True, simple: bool = True, inplace: bool = True, delayed: int = 0, colors: list = None) DataFrame | None
Calculate support and resistance levels for the Symbol based on either atomic trades or aggregated trades in a rolling window. Also from klines supported, but less accurate. It returns a pandas dataframe with each column representing ordered levels from lower to higher for support and resistance. The function iterates in steps of a minutes quantity or a discrete interval.
If discrete_interval is passed, it will ignore time_steps_minutes and minutes_window and will use this interval to calculate the rolling support and resistance minutes_window and time_steps_minutes. It can be any of the binance kline ones: ‘1m’, ‘3m’, ‘5m’, ‘15m’, ‘30m’, ‘1h’, ‘2h’, ‘4h’, etc
The parameter delayed is useful when you want to calculate the rolling support and resistance with a delay. For example, if you want to calculate the rolling support and resistance with the last 5 minutes of data, but you want to project it 5 minutes after the last minute of the window, you can pass delayed=1 (1 step of the interval selected). Useful for projecting support and resistance levels in the future.
If simple parameter is True, it will calculate support and resistance levels merged. Just levels. Default is True.
Example: If you want to calculate the rolling support and resistance with and interval of 24h and a delayed of 1, this will add past 24h support and resistance levels to the current dataframe
my_symbol.rolling_support_resistance(discrete_interval='1d', delayed=1)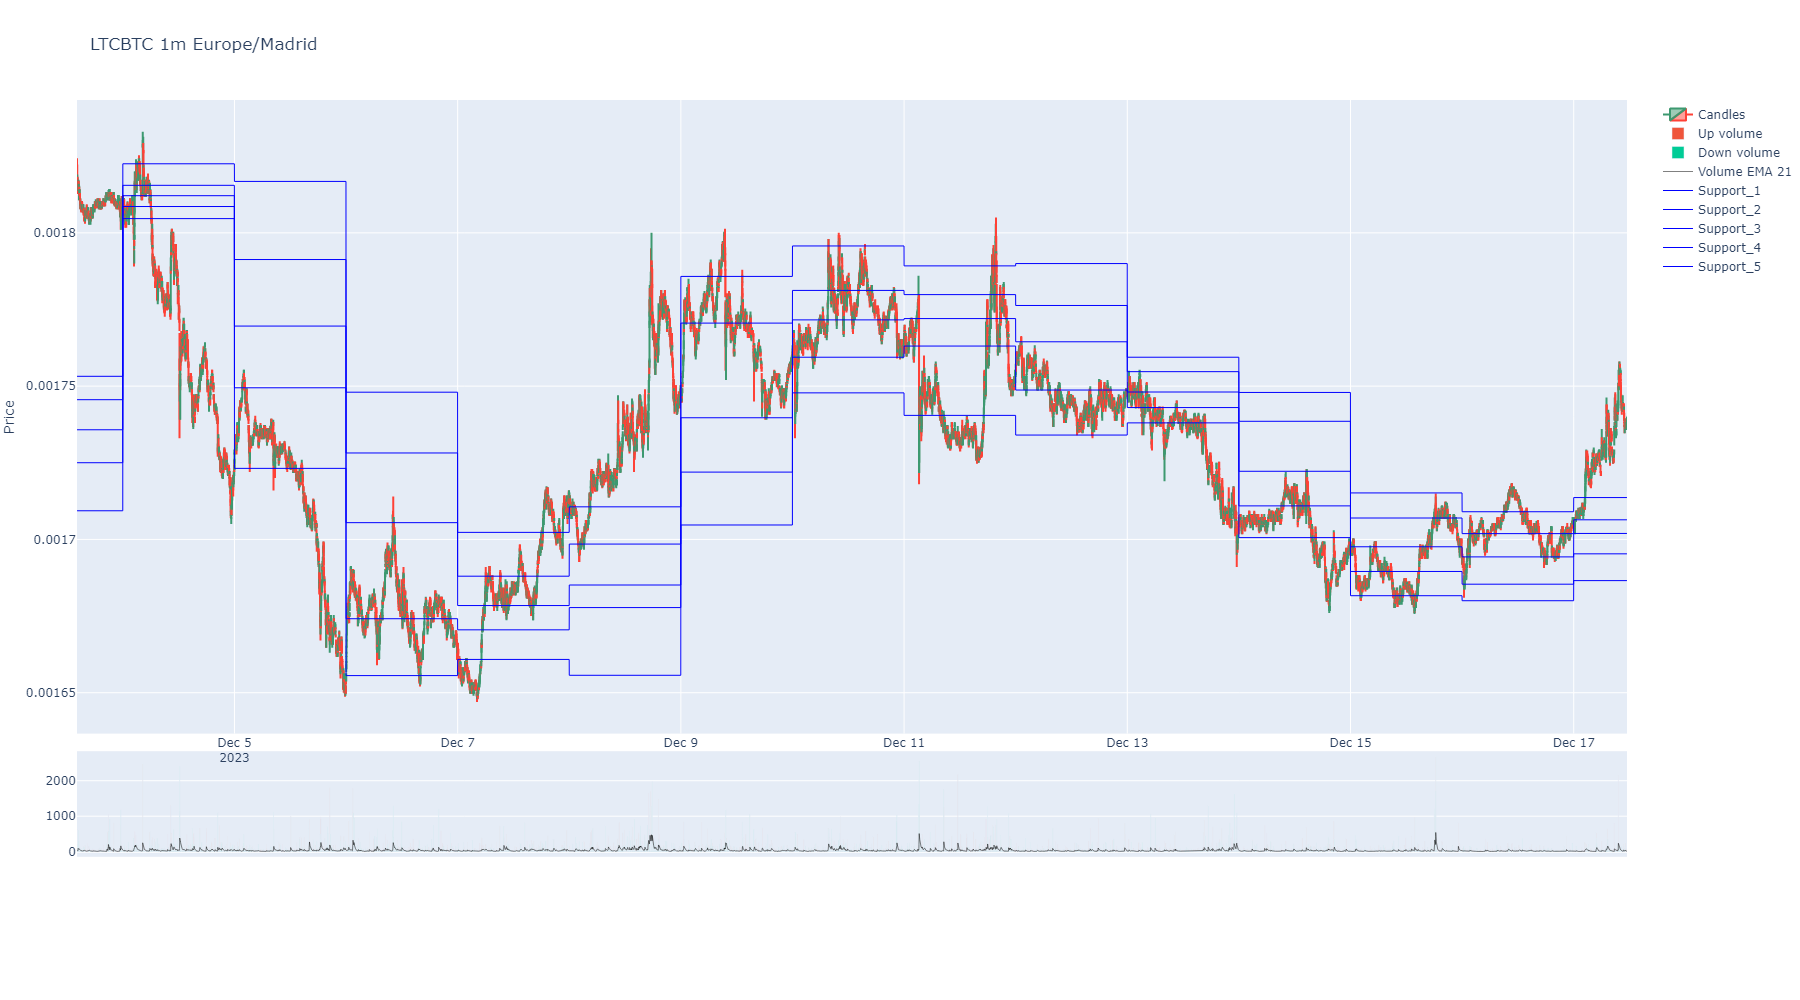
Example: Not discrete mode but same 24 h intervals and not delayed.
sym.rolling_support_resistance(minutes_window=24*60, time_steps_minutes=24*60, max_clusters=5)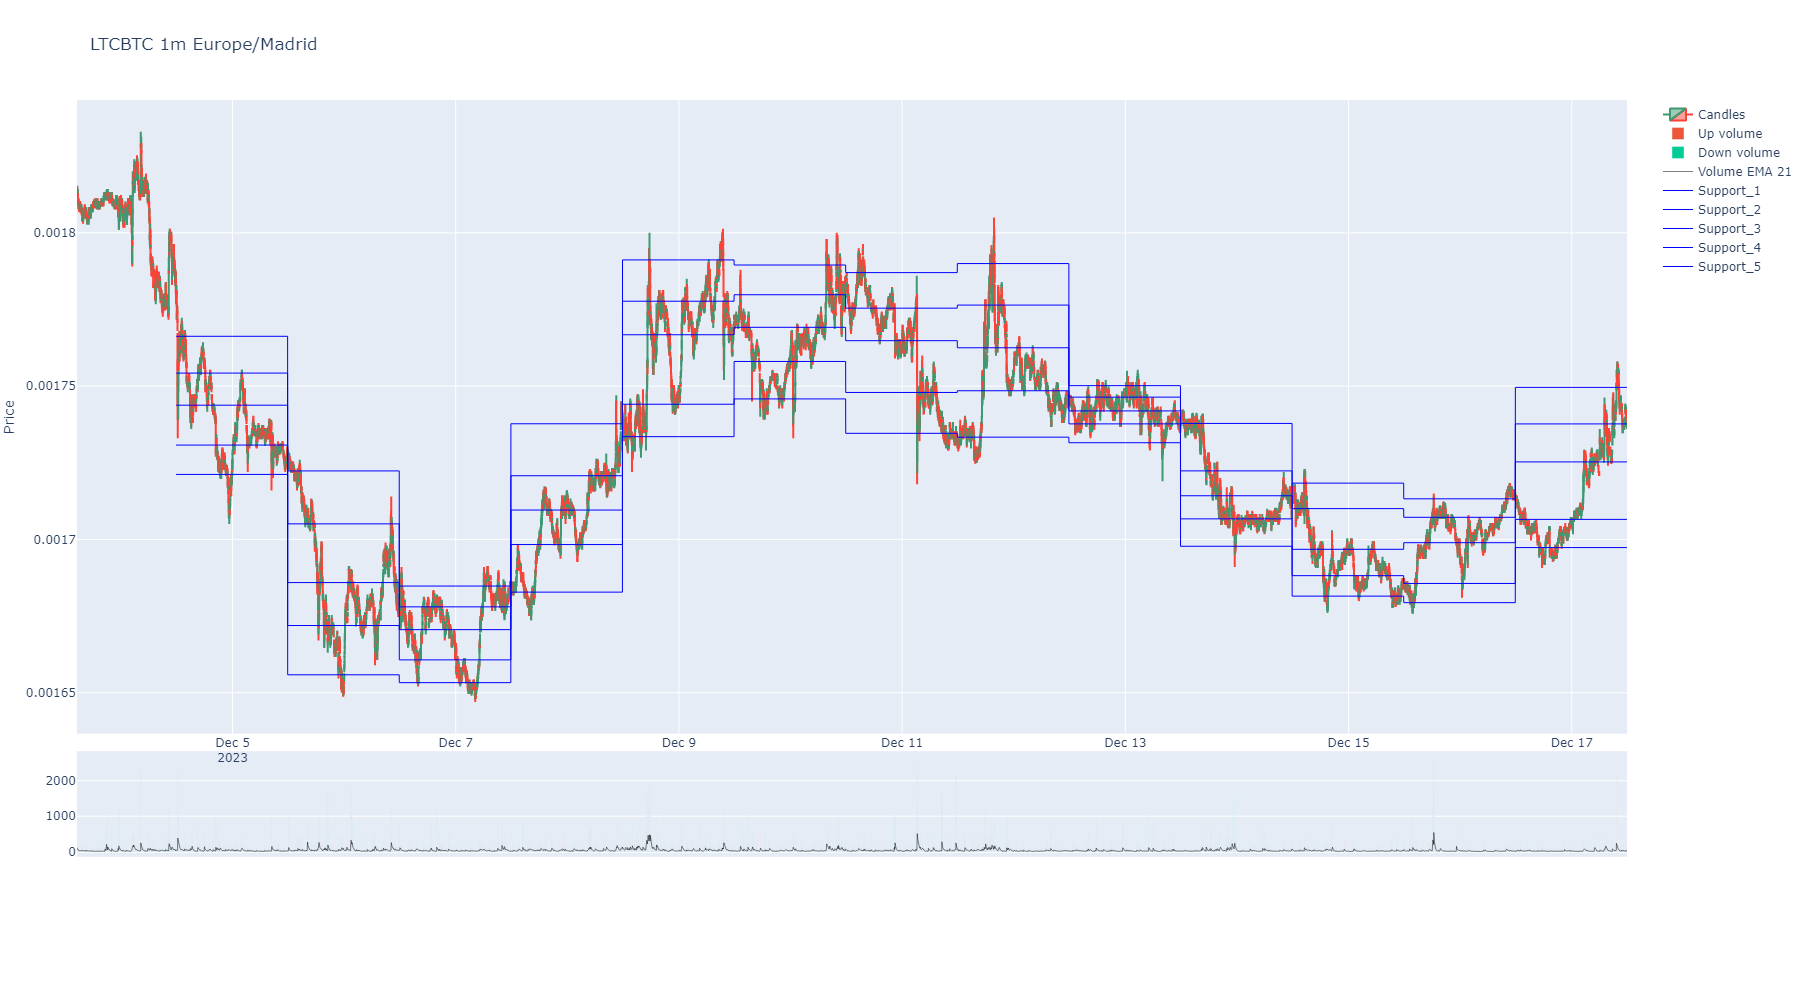
- Parameters:
minutes_window (int) – A rolling window of time in minutes. Whe using trades, it will calculate window by time index.
time_steps_minutes (int) – Loop steps in minutes. Default is 10. Each step will calculate a new window data.
discrete_interval (str) – If passed, it will ignore time_steps_minutes and minutes_window and will use this interval to calculate the rolling support and resistance. It can be any of the following: ‘1m’, ‘3m’, ‘5m’, ‘15m’, ‘30m’, ‘1h’, ‘2h’, ‘4h’, etc
from_atomic (bool) – If True, support and resistance levels will be calculated using atomic trades.
from_aggregated (bool) – If True, support and resistance levels will be calculated using aggregated trades.
max_clusters (int) – If passed, fixes count of levels of support and resistance. Default is 5.
by_quantity (float) – It takes each price into account by how many times the specified quantity appears in “Quantity” column.
simple (bool) – If True, it will calculate support and resistance levels merged. Just levels. Default is True.
inplace (bool) – If True, it will replace the current dataframe with the new one. Default is True.
delayed (int) – If passed, it will project the rolling support and resistance levels in the future. Default is 0 and means 0 windows projected in the future.
colors (list) – A list of colors for the indicator dataframe columns. Is the color to show when charts. It can be any color from plotly library or a number in the list of those. Default colors defined. https://community.plotly.com/t/plotly-colours-list/11730
- Return pd.DataFrame:
A pandas dataframe with each column representing ordered levels from higher to lower for support and resistance.
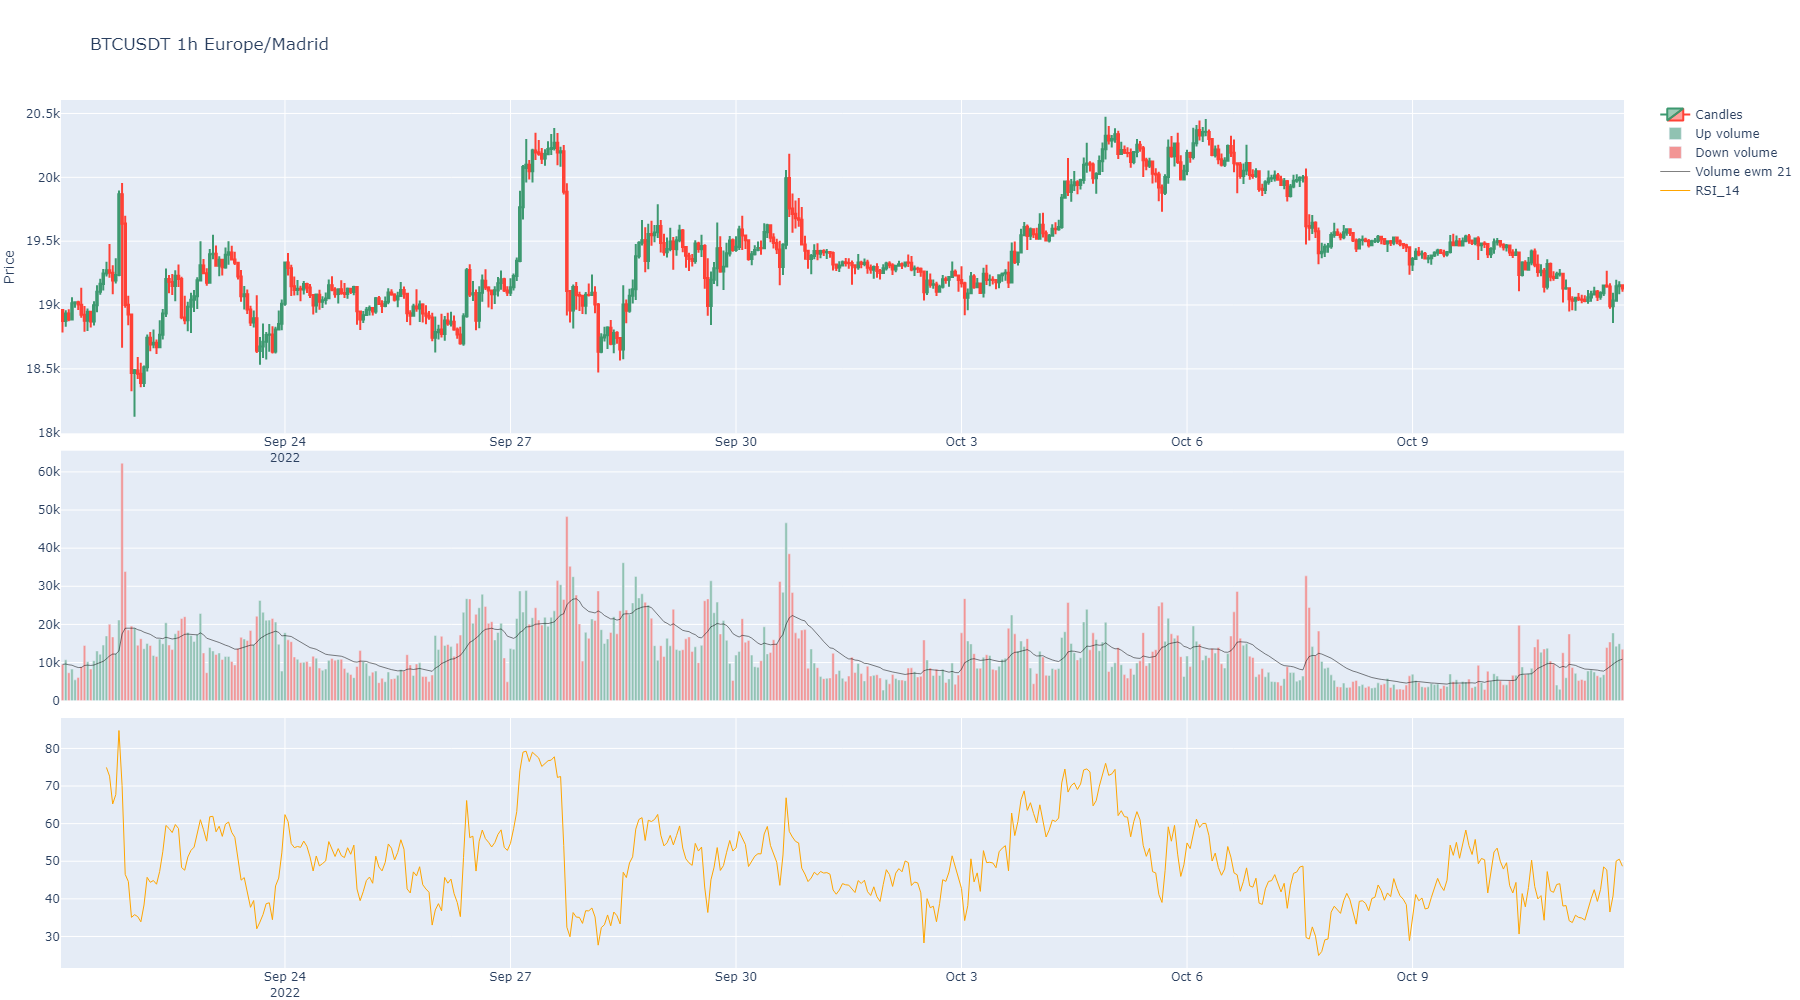
- rsi(length: int = 14, inplace: bool = True, suffix: str = '', color: str | int = None) Series
Relative Strength Index (RSI).
- Parameters:
- Returns:
A Pandas Series
- set_plot_axis_group(indicator_column: str = None, my_axis_group: str = None) dict
Internal control formatting plots. Can be used to change plot filling mode for pairs of indicators when.
- Parameters:
indicator_column (str) – column name
my_axis_group – Fill mode for indicator. Color can be forced to fill to zero line with “tozeroy” or between two indicators in same axis group with “tonexty”.
- Return dict:
columns with its assigned fill mode.
- set_plot_color(indicator_column: str = None, color: int | str = None) dict
Internal control formatting plots. Can be used to change plot color of an indicator.
- Parameters:
indicator_column (str) – column name
color – reassign color to column name
- Return dict:
columns with its assigned colors when charts.
- set_plot_color_fill(indicator_column: str = None, color_fill: str | bool = None) dict
Internal control formatting plots. Can be used to change plot color of an indicator.
- Parameters:
indicator_column (str) – column name
color_fill – Color can be forced to fill to zero line. For transparent colors use rgba string code to define color. Example for transparent green ‘rgba(26,150,65,0.5)’ or transparent red ‘rgba(204,0,0,0.5)’
- Return dict:
columns with its assigned colors when charts.
- set_plot_filled_mode(indicator_column: str = None, fill_mode: str = None) dict
Internal control formatting plots. Can be used to change plot filling mode for pairs of indicators when.
- Parameters:
indicator_column (str) – column name
fill_mode – Fill mode for indicator. Color can be forced to fill to zero line with “tozeroy” or between two indicators in same axis group with “tonexty”.
- Return dict:
columns with its assigned fill mode.
- set_plot_row(indicator_column: str = None, row_position: int = None) dict
Internal control formatting plots. Can be used to change plot subplot row of an indicator.
- Parameters:
indicator_column (str) – column name
row_position – reassign row_position to column name
- Return dict:
columns with its assigned row_position in subplots when charts.
- set_plot_splitted_serie_couple(indicator_column_up: str = None, indicator_column_down: str = None, splitted_dfs: list = None, color_up: str = 'rgba(35, 152, 33, 0.5)', color_down: str = 'rgba(245, 63, 39, 0.5)') dict
Modify the control for splitted series in plots with colored area in two colors by relative position.
If no params passed, then returns dict actual contents.
- Parameters:
indicator_column_up (str) – An existing column from a BinPan Symbol’s class dataframe to plot as up serie (green color).
indicator_column_down (str) – An existing column from a BinPan Symbol’s class dataframe to plot as down serie (red clor).
splitted_dfs (tuple) – A list of pairs of a splitted dataframe by two columns.
color_up – An rgba formatted color: https://rgbacolorpicker.com/
color_down – An rgba formatted color: https://rgbacolorpicker.com/
- Return dict:
A dictionary with auxiliar data about plot areas with two colours by relative position.
- set_plotting_volume_ma(window: int = 21) None
Set a window for plotting volume moving average on the candles plot when volumen bars are plotted.
- Parameters:
window (int) – A window for the moving average.
- set_strategy_groups(column: str, group: str, strategy_groups: dict = None) dict
Returns strategy_groups for BinPan DataFrame.
- shift(column: str | int | Series, window=1, strategy_group: str = '', inplace=True, suffix: str = '', color: str | int = 'grey') Series
It shifts a candle ahead by the window argument value (or backwards if negative)
- Parameters:
window (int) – Number of candles moved ahead.
strategy_group (str) – A name for a group of columns to assign to a strategy.
inplace (bool) – Permanent or not. Default is false, because of some testing required sometimes.
suffix (str) – A string to decorate resulting Pandas series name.
color (str | int) – A color from plotly list of colors or its index in that list.
- Return pd.Series:
A serie with tags as values.
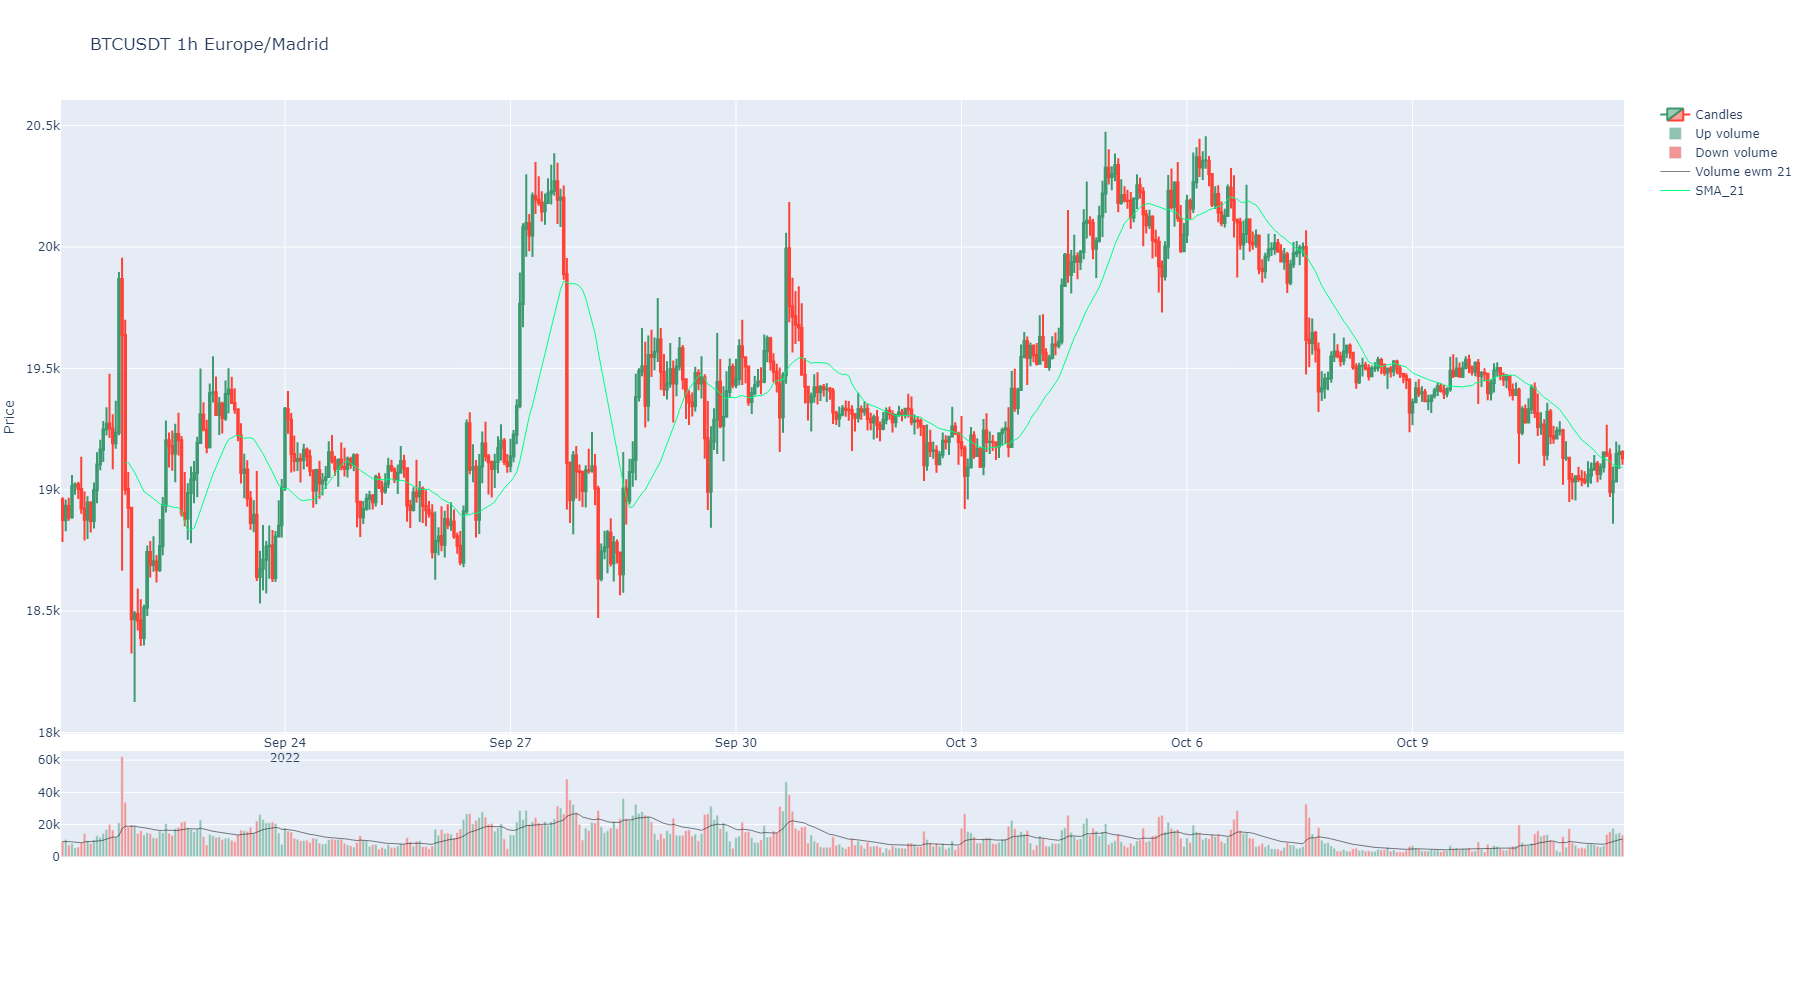
- sma(window: int = 21, column: str = 'Close', inplace=True, suffix: str = '', color: str | int = None, **kwargs) Series
Generate technical indicator Simple Moving Average.
- Parameters:
window (int) – Rolling window including the current candles when calculating the indicator.
column (str) – Column applied. Default is Close.
inplace (bool) – Make it permanent in the instance or not.
suffix (str) – A decorative suffix for the name of the column created.
color (str or int) – Color to show when charts. It can be any color from plotly library or a number in the list of those. <https://community.plotly.com/t/plotly-colours-list/11730>
kwargs – Optional plotly args from https://github.com/twopirllc/pandas-ta/blob/main/pandas_ta/overlap/sma.py
- Returns:
pd.Series
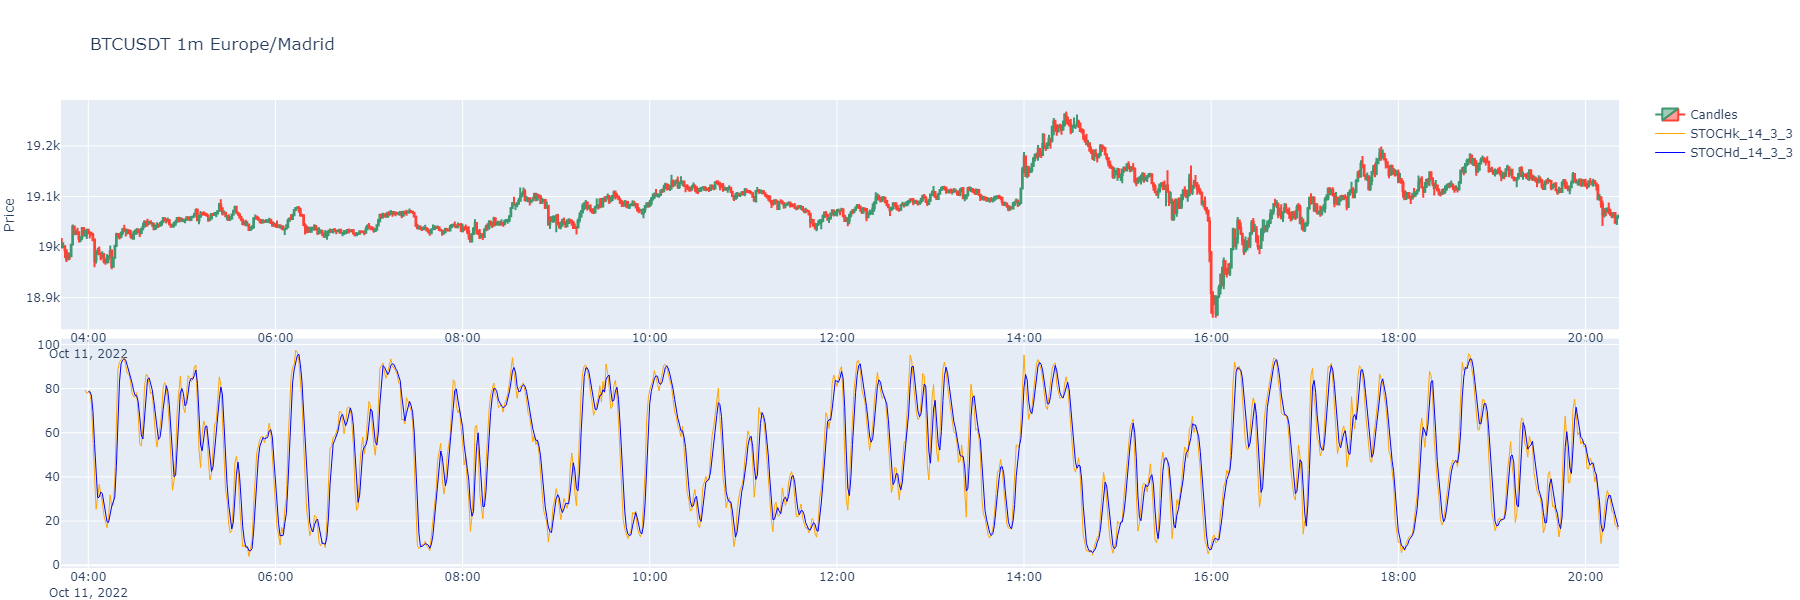
- stoch(k_length: int = 14, stoch_d=3, k_smooth: int = 1, inplace: bool = True, suffix: str = '', colors: list = None, **kwargs) DataFrame
Stochastic Oscillator with a fast and slow exponential moving averages.
- Parameters:
k_length (int) – The Fast %K period. Default: 14
stoch_d (int) – The Slow %K period. Default: 3
k_smooth (int) – The Slow %D period. Default: 3
inplace (bool) – Make it permanent in the instance or not.
suffix (str) – A decorative suffix for the name of the column created.
colors (list) – Is the color to show when charts.
kwargs – Optional from https://github.com/twopirllc/pandas-ta/blob/main/pandas_ta/momentum/stoch.py
- Returns:
A Pandas DataFrame
- stoch_rsi(rsi_length: int = 14, k_smooth: int = 3, d_smooth: int = 3, inplace: bool = True, suffix: str = '', colors: list = None, **kwargs) DataFrame
Stochastic Relative Strength Index (RSI) with a fast and slow exponential moving averages.
- Parameters:
rsi_length (int) – Default is 21
k_smooth (int) – Smooth fast line with a moving average of some periods. default is 3.
d_smooth (int) – Smooth slow line with a moving average of some periods. default is 3.
inplace (bool) – Make it permanent in the instance or not.
suffix (str) – A decorative suffix for the name of the column created.
colors (list) – Is the color to show when charts.
kwargs – Optional from https://github.com/twopirllc/pandas-ta/blob/main/pandas_ta/momentum/stochrsi.py
- Returns:
A Pandas DataFrame
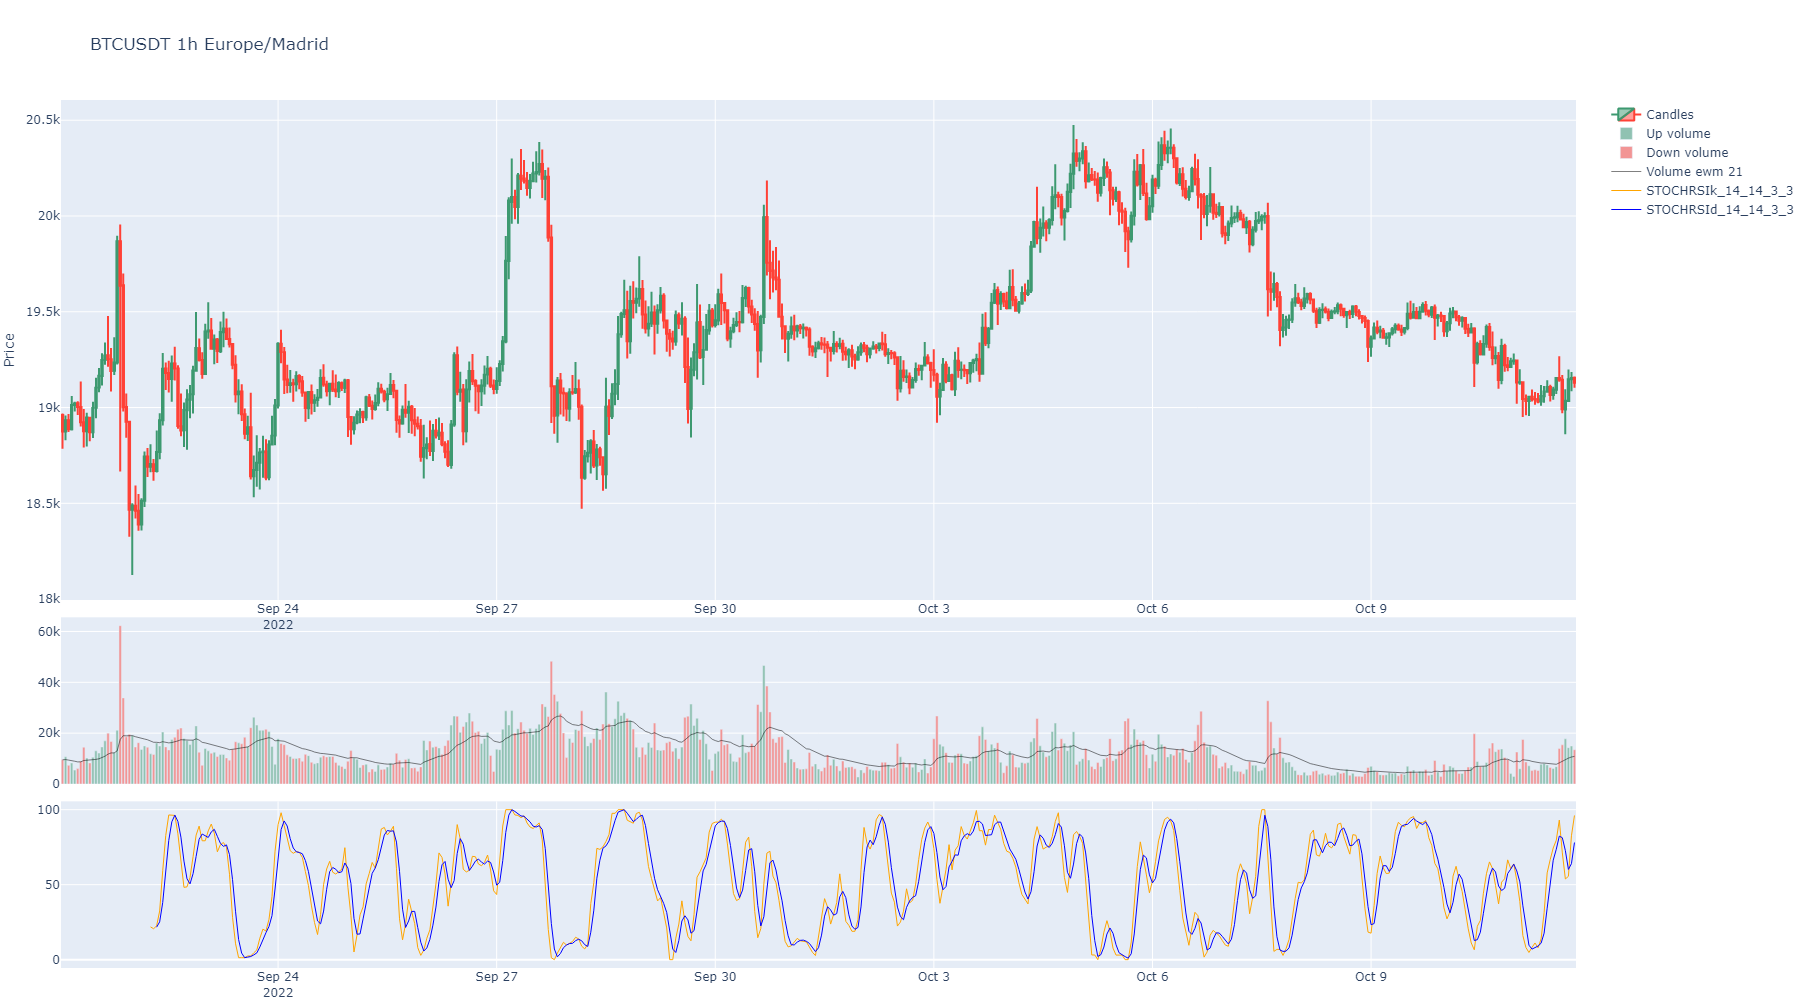
- strategy_from_tags_crosses(columns: list = None, strategy_group: str = '', matching_tag=1, method: str = 'all', tag_reversed_match: bool = False, inplace=True, suffix: str = '', color: str | int = 'magenta', reversed_match=-1) Series
Checks where all tags and cross columns get value “1” at the same time. And also gets points where all tags gets value of “0” and cross columns get “-1” value.
- Parameters:
columns (list) – A list of Tag and Cross columns with numeric o 1,0 for tags and 1,-1 for cross points.
strategy_group (str) – A name for a group of columns to restrict application of strategy. If both columns and strategy_group passed, a interjection between the two arguments is applied.
tag_reversed_match (bool) – If enabled, all zeros or minus ones tag and cross columns are interpreted as reversed match, this will enable tagging those.
matching_tag (any) – A tag to search for the strategy where will be revised method for matched rows.
method (str) – Can be ‘all’ or ‘any’. It produces a match when all or any columns are matching tags.
reversed_match (any) – A tag for the all/any not matched strategy rows.
inplace (bool) – Permanent or not. Default is false, because of some testing required sometimes.
suffix (str) – A string to decorate resulting Pandas series name.
color (str | int) – A color from plotly list of colors or its index in that list.
- Return pd.Series:
A serie with “1” value where all columns are ones and “-1” where all columns are minus ones.
- supertrend(length: int = 10, multiplier: int = 3, inplace=True, suffix: str = None, colors: list = None, **kwargs) DataFrame
Generate technical indicator Supertrend.
- Parameters:
length (int) – Rolling window including the current candles when calculating the indicator.
multiplier (int) – Indicator multiplier applied.
inplace (bool) – Make it permanent in the instance or not.
suffix (str) – A decorative suffix for the name of the column created.
colors (list) – Defaults to red and green.
kwargs – Optional plotly args from https://github.com/twopirllc/pandas-ta/blob/main/pandas_ta/overlap/supertrend.py.
- Returns:
pd.DataFrame
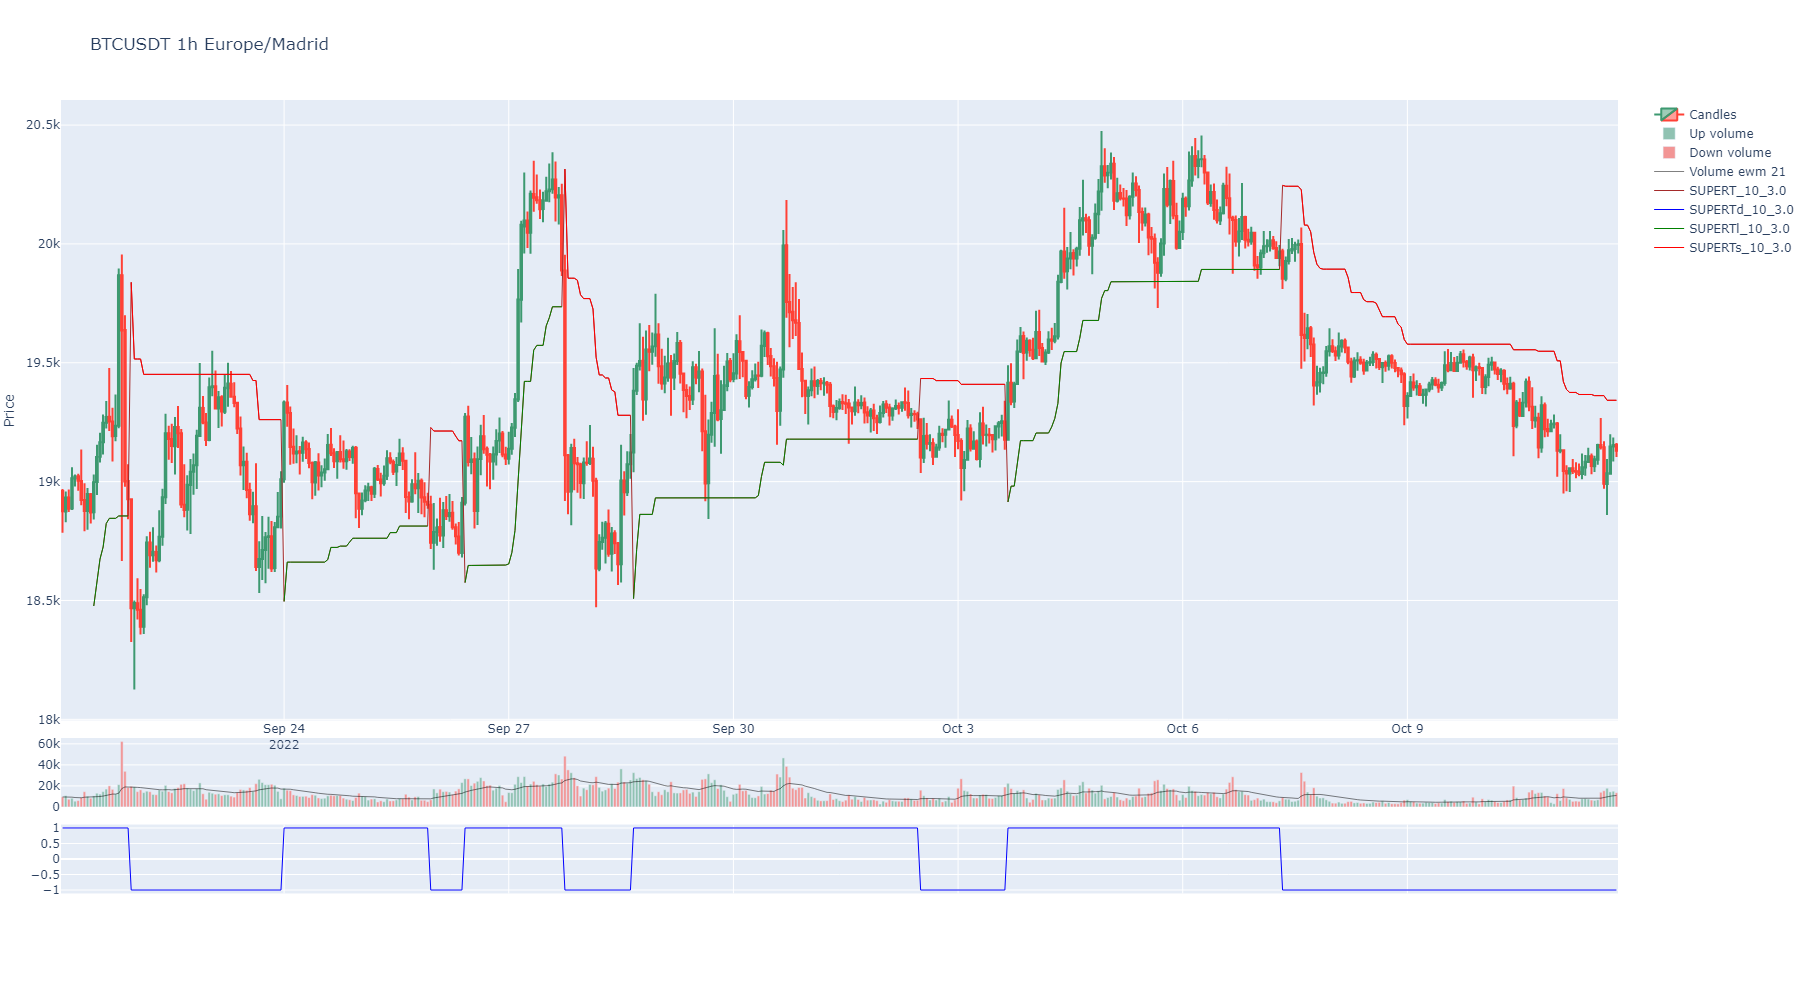
- support_resistance(from_atomic: bool = False, from_aggregated: bool = False, max_clusters: int = 5, by_quantity: float = None, simple: bool = True, inplace=True, colors: list = None) tuple[list[float], list[float]]
Calculate support and resistance levels for the Symbol based on either atomic trades or aggregated trades.
- Parameters:
from_atomic (bool) – If True, support and resistance levels will be calculated using atomic trades.
from_aggregated (bool) – If True, support and resistance levels will be calculated using aggregated trades.
max_clusters (int) – If passed, fixes count of levels of support and resistance. Default is 5.
by_quantity (float) – It takes each price into account by how many times the specified quantity appears in “Quantity” column.
simple (bool) – If True, it will calculate support and resistance levels merged. Just levels. Default is True.
inplace (bool) – If True, it will replace the current dataframe with the new one. Default is True.
colors (list) – A list of colors for the indicator dataframe columns. Is the color to show when charts. It can be any color from plotly library or a number in the list of those. Default colors defined. https://community.plotly.com/t/plotly-colours-list/11730
- Returns:
A tuple containing two lists: the first list contains support levels, and the second list contains resistance levels.
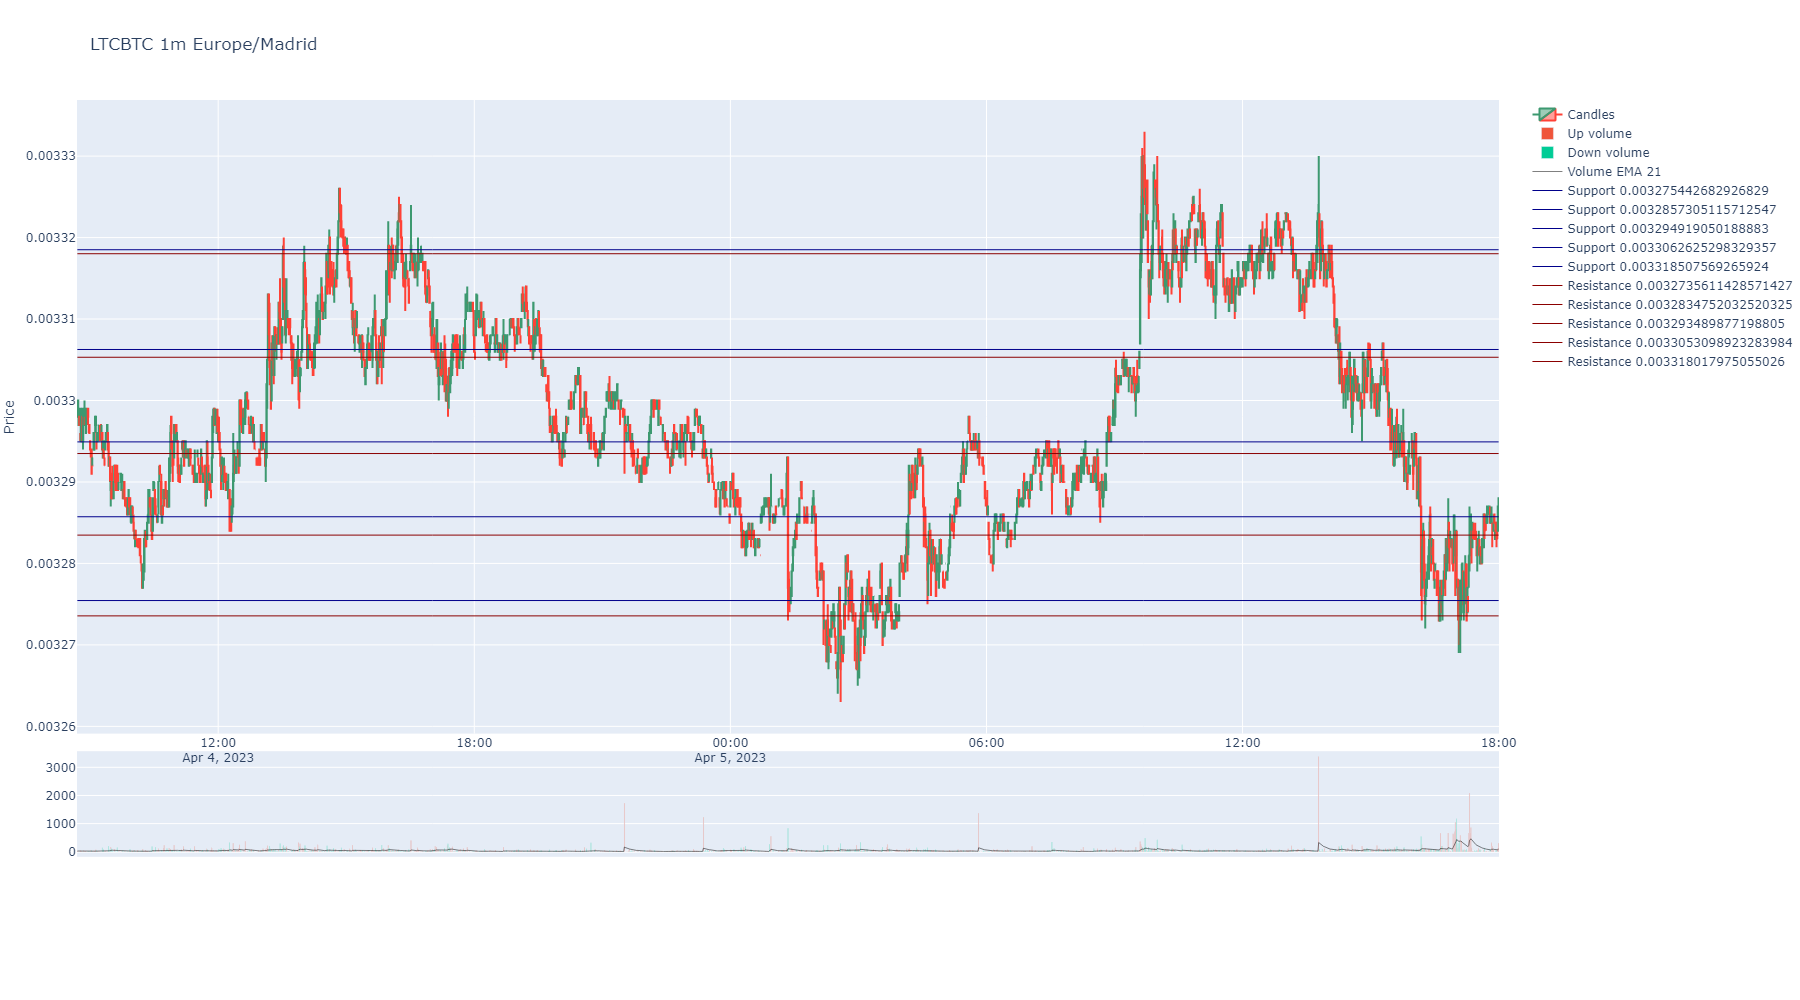
- tag(column: str | int | Series, reference: str | int | float | Series, relation: str = 'gt', match_tag: str | int = 1, mismatch_tag: str | int = 0, strategy_group: str = '', inplace=True, suffix: str = '', color: str | int = 'green') Series
It tags values of a column/serie compared to other serie or value by methods gt,ge,eq,le,lt as condition.
- Parameters:
column (pd.Series | str) – A numeric serie or column name or column index. Default is Close price.
reference (pd.Series | str | int | float) – A number or numeric serie or column name.
relation (str) – The condition to apply comparing column to reference (default is greater than): eq (equivalent to ==) - equals to ne (equivalent to !=) - not equals to le (equivalent to <=) - less than or equals to lt (equivalent to <) - less than ge (equivalent to >=) - greater than or equals to gt (equivalent to >) - greater than
match_tag (int | str) – Value or string to tag matched relation.
mismatch_tag (int | str) – Value or string to tag mismatched relation.
strategy_group (str) – A name for a group of columns to assign to a strategy.
inplace (bool) – Permanent or not. Default is false, because of some testing required sometimes.
suffix (str) – A string to decorate resulting Pandas series name.
color (str | int) – A color from plotly list of colors or its index in that list.
- Return pd.Series:
A serie with tags as values.
import binpan

sym = binpan.Symbol('btcbusd', '1m')
sym.ema(window=200, color='darkgrey')

# comparing close price (default) greater or equal, than exponential moving average of 200 ticks window previously added.
sym.tag(reference='EMA_200', relation='ge')
sym.plot()
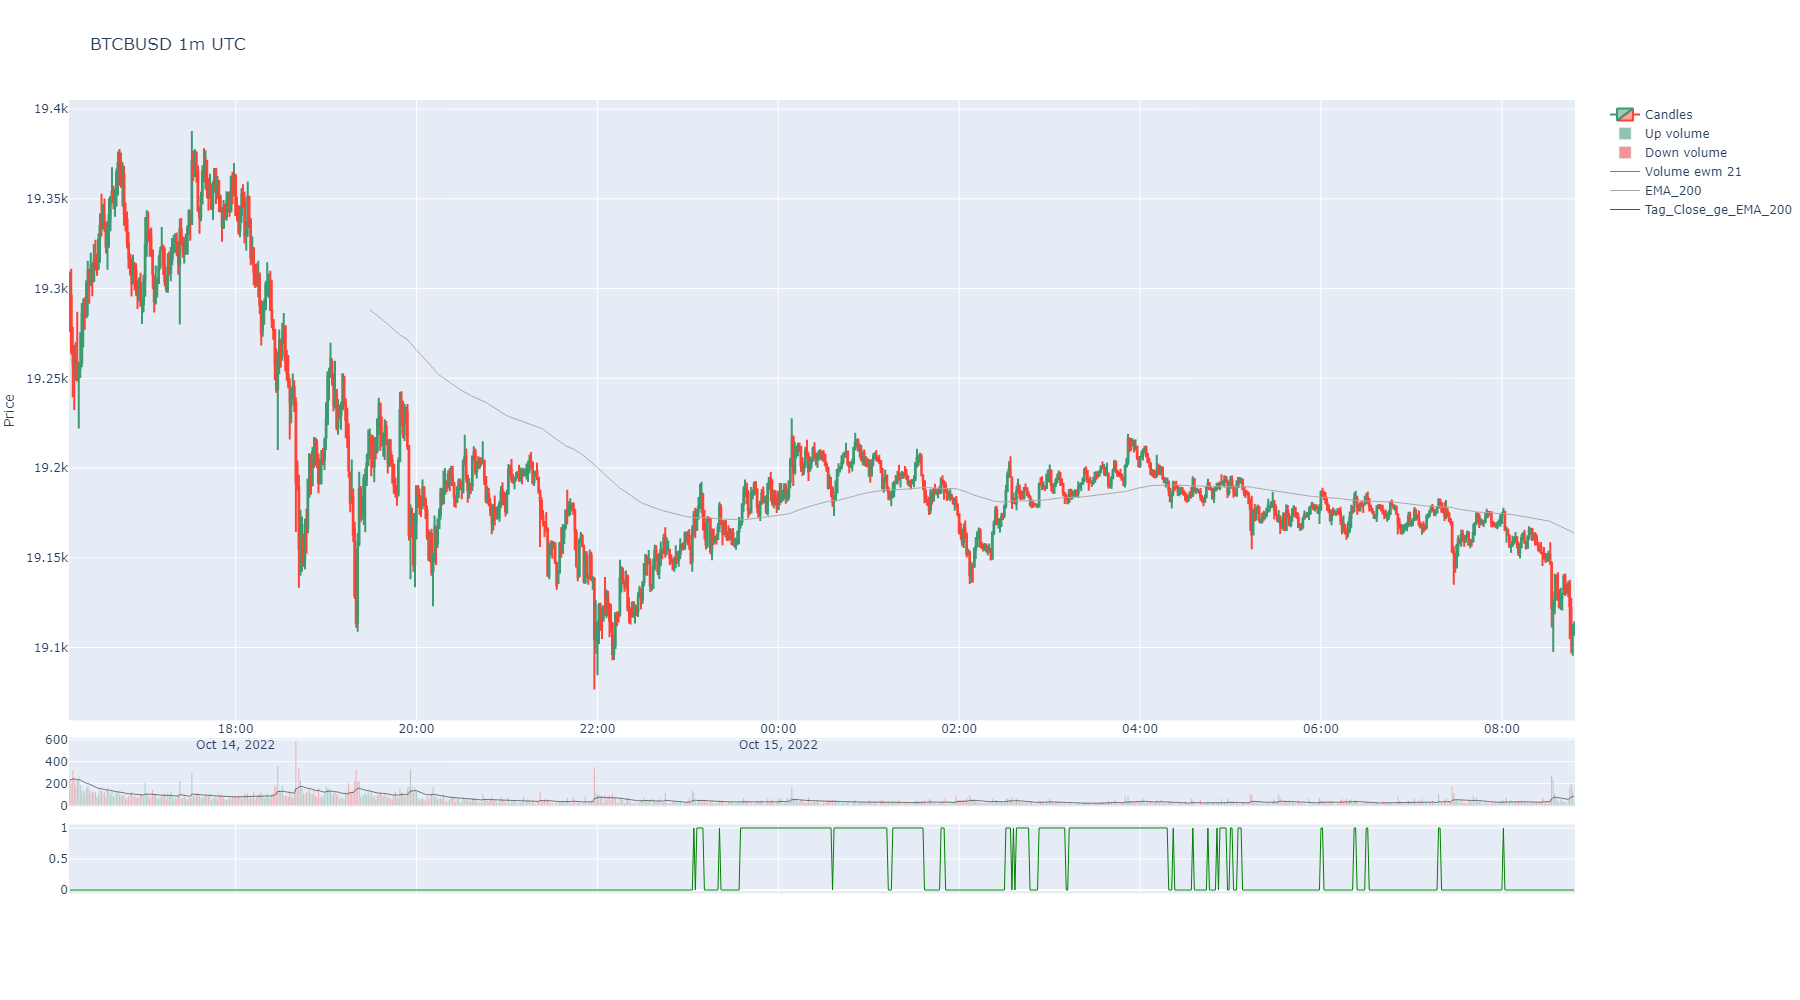
- time_centroids(from_atomic: bool = False, from_aggregated: bool = False, max_clusters: int = 5, by_quantity: float = None, simple: bool = True) tuple[list[float], list[float]]
Calculate centroids for timestamps of more activity in taker buys or takers sells.
- Parameters:
from_atomic (bool) – If True, centroids will be calculated using atomic trades.
from_aggregated (bool) – If True, centroids will be calculated using aggregated trades.
max_clusters (int) – If passed, fixes count of levels of support and resistance. Default is 5.
by_quantity (float) – It takes each price into account by how many times the specified quantity appears in “Quantity” column.
simple (bool) – If True, it will calculate centroids merged. Just levels, not buy or sell centroids. Default is True.
- Returns:
A tuple containing two lists: the first list contains buy centroids, and the second list contains sell centroids.
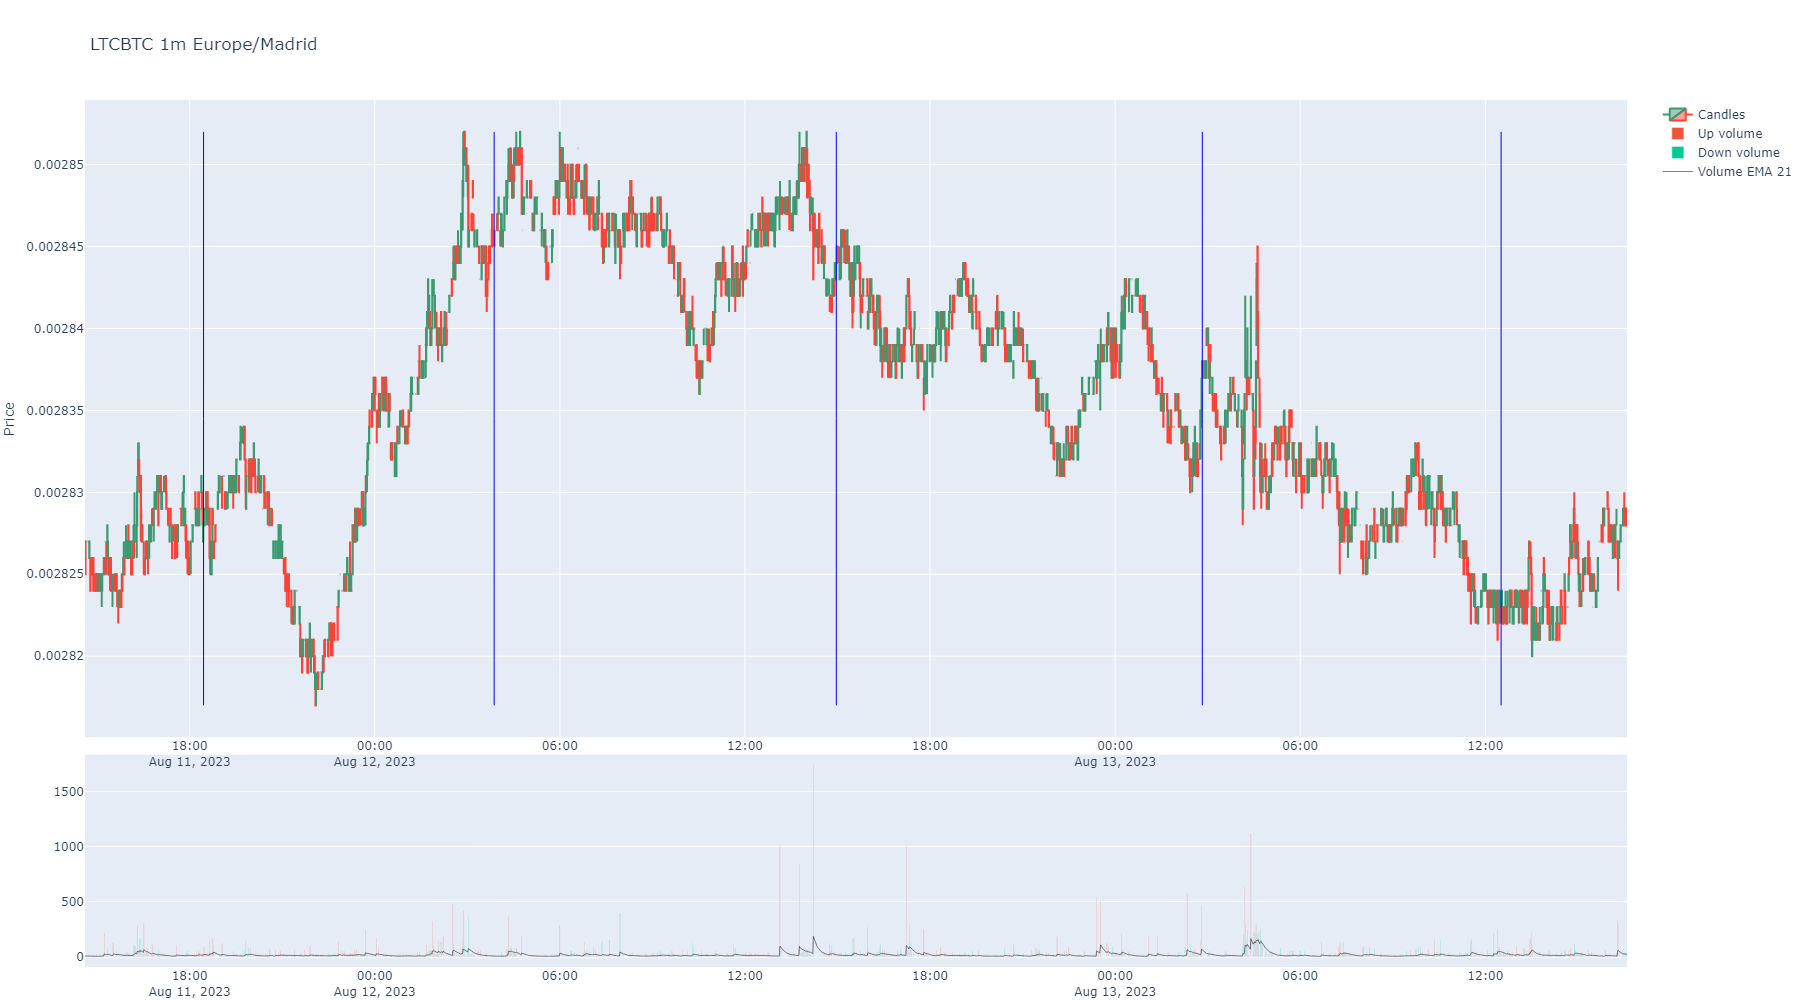
- update_info_dic() dict[source]
Returns exchangeInfo data when instantiated. It includes, filters, fees, and many other data for all symbols in the exchange.
- Return dict:
Full exchange info dictionary for all symbols.
- volume_profile(bins: int = 50, value_area_pct: float = 0.7, from_agg_trades: bool = False, from_atomic_trades: bool = False, hours: int = None, minutes: int = None, startTime: int | str = None, endTime: int | str = None, time_zone: str = None) dict | None
Volume Profile (VPVR): volumen por nivel de precio + POC, Value Area y nodos HVN/LVN.
Calcula el market profile (reutiliza
get_market_profile()) y le aplica las metricas de un Volume Profile: POC (nivel de mayor volumen, el iman), Value Area (rango que concentravalue_area_pctdel volumen) y los HVN/LVN (nodos de alto/bajo volumen: aceptacion vs huecos por donde el precio viaja rapido). Devuelve numeros para razonar sin mirar el grafico; para el grafico usaplot_volume_profile().- Parameters:
bins (int) – numero de niveles del histograma. Default 50.
value_area_pct (float) – fraccion del volumen dentro de la Value Area. Default 0.70.
from_agg_trades (bool) – usa aggregated trades (requiere
get_agg_trades()antes).from_atomic_trades (bool) – usa atomic trades (requiere
get_atomic_trades()antes).hours (int) – si se pasa, solo las ultimas ‘hours’ horas.
minutes (int) – si se pasa, solo los ultimos ‘minutes’ minutos.
startTime – timestamp/fecha de inicio (%Y-%m-%d %H:%M:%S).
endTime – timestamp/fecha de fin.
time_zone (str) – zona horaria para el indice temporal.
- Returns:
dict con
poc,vah,val,value_area_pct,total_volume,bins(lista de{price, low, high, volume}),hvnylvn.Nonesi no hay datos.
Ejemplo:
sym = binpan.Symbol('BTCUSDT', '15m', limit=500)
vp = sym.volume_profile(bins=50)
print(vp["poc"], vp["vah"], vp["val"])
- vwap(anchor: str = 'D', inplace: bool = True, suffix: str = '', color: str | int = None, **kwargs) Series
Volume Weighted Average Price.
- Parameters:
anchor (str) – How to anchor VWAP. Depending on the index values, it will implement various Timeseries Offset Aliases as listed here: https://pandas.pydata.org/pandas-docs/stable/user_guide/timeseries.html#timeseries-offset-aliases Default: “D”, that means calendar day frequency.
inplace (bool) – Make it permanent in the instance or not.
suffix (str) – A decorative suffix for the name of the column created.
color (str or int) – Is the color to show when plotting or index in that list.
kwargs – Optional from https://github.com/twopirllc/pandas-ta/blob/main/pandas_ta/overlap/vwap.py
- Returns:
A Pandas Series
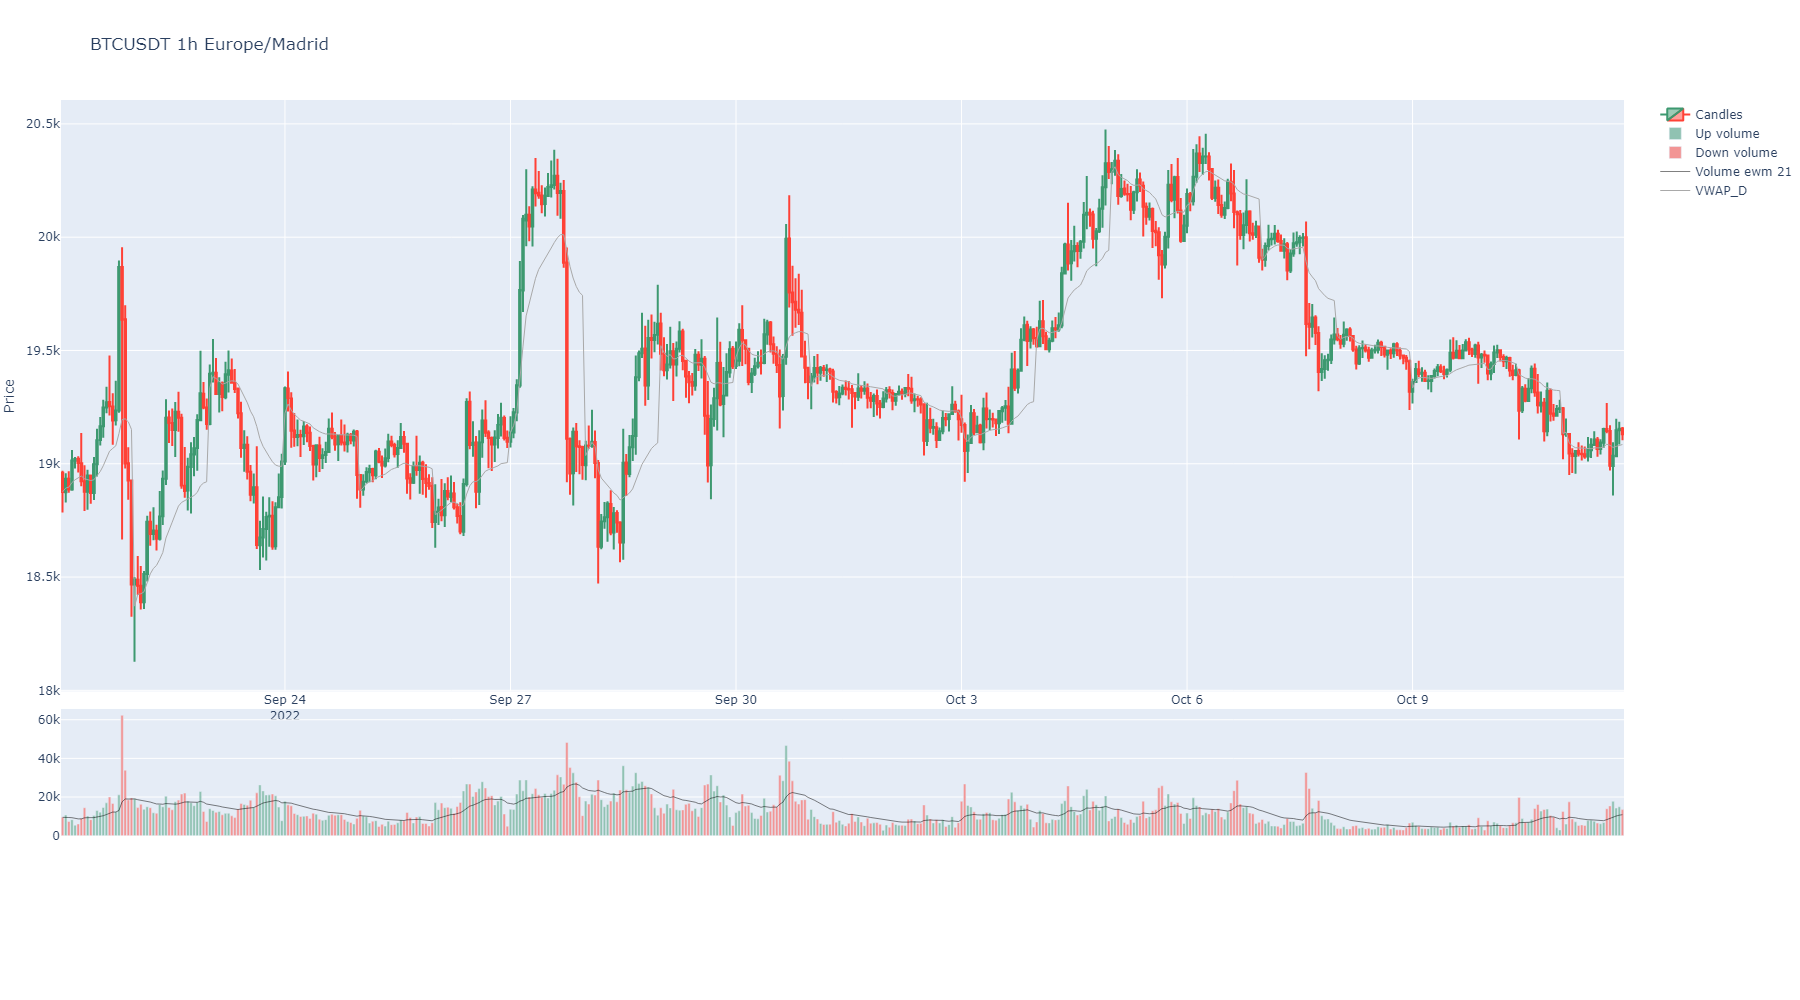
- get_order_filters() dict[source]
Get exchange info about the symbol for order filters.
- Return dict:
Dictionary of order filters for the symbol.
- get_order_types() list[source]
Get exchange info about the symbol for order types.
- Return list:
List of available order types for the symbol.
- get_permissions() list[source]
Get exchange info about the symbol for trading permissions.
- Return list:
Trading permissions for the symbol.
- get_precision() dict[source]
Get exchange info about the symbol for assets precision.
- Return dict:
Precision settings for base and quote assets.
- get_api_status() str[source]
Return the symbol status, TRADING, BREAK, etc.
- Return str:
Current trading status (e.g.
'TRADING','BREAK').
- get_fees(symbol: str = None) dict[source]
Shows applied fees for the symbol of the object.
Requires Binance API credentials, managed by panzer (~/.panzer_creds). panzer prompts for them on first use if missing.
- Parameters:
symbol – Not to use it, just here for initializing the class.
- Returns:
Dictionary
Exchange Class
Provides access to Binance exchange-level metadata: trading pairs, order types, filters, fees, coin information, blockchain network details, and 24h volume rankings.
- class Exchange[source]
Exchange data.
Exchange data collected in class variables:
my_exchange_instance.info_dic: A dictionary with all raw symbols info each.
my_exchange_instance.coins_dic: A dictionary with all coins info.
my_exchange_instance.bases: A dictionary with all bases for all symbols.
my_exchange_instance.quotes: A dictionary with all quotes for all symbols.
my_exchange_instance.leveraged: A list with all leveraged coins.
my_exchange_instance.leveraged_symbols: A list with all leveraged symbols.
my_exchange_instance.fees: dataframe with fees applied to the user requesting for every symbol.
my_exchange_instance.filters: A dictionary with all trading filters detailed with all symbols.
my_exchange_instance.status: API status can be normal o under maintenance.
my_exchange_instance.coins: A dataframe with all the coin’s data.
my_exchange_instance.networks: A dataframe with info about every coin and its blockchain networks info.
my_exchange_instance.coins_list: A list with all the coin’s names.
my_exchange_instance.symbols: A list with all the symbols names.
my_exchange_instance.df: A dataframe with all the symbols info.
my_exchange_instance.order_types: Dataframe with each symbol order types.
Credentials are managed by panzer’s CredentialManager (~/.panzer_creds). On first use, panzer will prompt for API key and secret if not already stored.
Methods:
filter(symbol)Returns exchange filters applied for orders with the selected symbol.
fee(symbol)Returns exchange fees applied for orders with the selected symbol.
coin(coin)Returns coin exchange info in a pandas serie.
network(coin)Returns a dataframe with all exchange networks of one specified coin or every coin.
update_info([symbol])Updates from API and returns a dict with all merged exchange info about a symbol.
get_symbols([coin, base, quote])Return list of all symbols for a coin.
get_df()Extended symbols dataframe with exchange info about trading permissions, trading or blocked symbol, order types, margin allowed, etc
Returns a dataframe with order types for symbol.
get_volume_24h([quote, tradeable, ...])Returns a dataframe with 24-hour USDT volume for each cryptocurrency symbol.
get_usdt_volume_24h([quote])Returns a dataframe with 24h busd volume for every symbol.
get_statistics_24h([symbol, quote])Returns a dataframe with 24h statistics for every symbol.
- filter(symbol: str)[source]
Returns exchange filters applied for orders with the selected symbol.
- Parameters:
symbol (str)
- Return dict:
- fee(symbol: str)[source]
Returns exchange fees applied for orders with the selected symbol.
- Parameters:
symbol (str)
- Return pd.Series:
- coin(coin: str)[source]
Returns coin exchange info in a pandas serie.
- Parameters:
coin (str)
- Return pd.Series:
- network(coin: str)[source]
Returns a dataframe with all exchange networks of one specified coin or every coin.
- Parameters:
coin (str)
- Return pd.Series:
- update_info(symbol: str = None)[source]
Updates from API and returns a dict with all merged exchange info about a symbol.
- Parameters:
symbol (str)
- Return dict:
- get_symbols(coin: str = None, base: bool = True, quote: bool = True)[source]
Return list of all symbols for a coin. Can be selected symbols where it is base, or quote, or both. By default, returns all symbols where coin is base or quote but you can deactivate one of them.
- get_df()[source]
Extended symbols dataframe with exchange info about trading permissions, trading or blocked symbol, order types, margin allowed, etc
- Return pd.DataFrame:
An exchange dataframe with all symbols data.
- get_volume_24h(quote: str = 'USDT', tradeable=True, spot_required=True, margin_required=True, drop_legal=True, filter_leveraged=True, info_dic=None, sort_by: str = None) DataFrame[source]
Returns a dataframe with 24-hour USDT volume for each cryptocurrency symbol.
- Parameters:
quote – Optional string to filter by a specific quote currency (e.g., ‘USDT’).
tradeable – Optional boolean to return only tradeable symbols.
spot_required – Optional boolean to return only spot tradeable symbols.
margin_required – Optional boolean to return only margin tradeable symbols.
drop_legal – Optional boolean to exclude legal symbols.
filter_leveraged – Optional boolean to exclude leveraged symbols.
info_dic – Optional dictionary containing additional information.
sort_by – Optional string to sort the dataframe by a specific column.
- Returns:
Pandas DataFrame with columns like ‘symbol’, ‘USDT_volume’, ‘openPrice’, ‘highPrice’, ‘lowPrice’, ‘volume’, ‘quoteVolume’, ‘weightedAvgPrice’, ‘priceChange’, ‘priceChangePercent’, ‘lastPrice’, etc., for each symbol.
Wallet Class
Shows wallet data: free and locked assets, wallet snapshots for performance analysis. Requires API key and secret.
- class Wallet(time_zone='UTC', snapshot_days: int = 30)[source]
Wallet is a BinPan Class that can give information about balances, in Spot or Margin trading.
Also can show snapshots of the account status days ago, or using timestamps.
Credentials are managed by panzer’s CredentialManager (~/.panzer_creds). On first use, panzer will prompt for API key and secret if not already stored.
Methods:
update_spot([decimal_mode])Updates balances in the class object.
update_spot_snapshot([startTime, endTime, ...])Updates spot wallet snapshot and stores it in
self.spot_snapshot.update_margin([decimal_mode])Updates balances in the wallet class object.
update_margin_snapshot([startTime, endTime, ...])Updates margin wallet snapshot and stores it in
self.margin_snapshot.spot_wallet_performance(decimal_mode[, ...])Calculate difference between current wallet not locked values and days before.
margin_wallet_performance(decimal_mode[, ...])Calculate difference between current wallet not locked values and days before.
- update_spot(decimal_mode=False)[source]
Updates balances in the class object. :param bool decimal_mode: Use of decimal objects instead of float. :return dict: Wallet dictionary
- update_spot_snapshot(startTime: int | str = None, endTime: int | str = None, snapshot_days=30, time_zone=None)[source]
Updates spot wallet snapshot and stores it in
self.spot_snapshot.- Parameters:
startTime (int or str) – Can be integer timestamp in milliseconds or formatted string: 2022-05-11 06:45:42
endTime (int or str) – Can be integer timestamp in milliseconds or formatted string: 2022-05-11 06:45:42
snapshot_days (int) – Days to look if not start time or endtime passed.
time_zone (str) – A time zone for time index conversion. Example: “Europe/Madrid”
- Return pd.DataFrame:
Spot wallet snapshot for the time period requested.
- update_margin(decimal_mode=False)[source]
Updates balances in the wallet class object.
- Parameters:
decimal_mode (bool) – Use of decimal objects instead of float.
- Return dict:
Wallet dictionary
- update_margin_snapshot(startTime: int | str = None, endTime: int | str = None, snapshot_days=30, time_zone=None)[source]
Updates margin wallet snapshot and stores it in
self.margin_snapshot.- Parameters:
startTime (int or str) – Can be integer timestamp in milliseconds or formatted string: 2022-05-11 06:45:42
endTime (int or str) – Can be integer timestamp in milliseconds or formatted string: 2022-05-11 06:45:42
snapshot_days (int) – Days to look if not start time or endtime passed.
time_zone (str) – A time zone for time index conversion. Example: “Europe/Madrid”
- Return pd.DataFrame:
Margin wallet snapshot for the time period requested.
- spot_wallet_performance(decimal_mode: bool, startTime=None, endTime=None, days: int = 30, convert_to: str = 'BUSD')[source]
Calculate difference between current wallet not locked values and days before. :param bool decimal_mode: Fixes Decimal return type and operative. :param int or str startTime: Can be integer timestamp in milliseconds or formatted string: 2022-05-11 06:45:42 :param int or str endTime: Can be integer timestamp in milliseconds or formatted string: 2022-05-11 06:45:42 :param int days: Days to compare balances. :param str convert_to: Converts balances to a coin. :return float: Value increase or decrease with current value of convert_to coin.
- margin_wallet_performance(decimal_mode: bool, startTime=None, endTime=None, days: int = 30, convert_to: str = 'BUSD')[source]
Calculate difference between current wallet not locked values and days before. :param bool decimal_mode: Fixes Decimal return type and operative. :param int or str startTime: Can be integer timestamp in milliseconds or formatted string: 2022-05-11 06:45:42 :param int or str endTime: Can be integer timestamp in milliseconds or formatted string: 2022-05-11 06:45:42 :param int days: Days to compare balances. :param str convert_to: Converts balances to a coin. :return float: Value increase or decrease with current value of convert_to coin.
Database Class
Connector for PostgreSQL/TimescaleDB databases for storing and retrieving historical market data (klines, trades).